Unlock a world of possibilities! Login now and discover the exclusive benefits awaiting you.
- Qlik Community
- :
- Forums
- :
- Analytics
- :
- New to Qlik Analytics
- :
- Re: Color for expression
- Subscribe to RSS Feed
- Mark Topic as New
- Mark Topic as Read
- Float this Topic for Current User
- Bookmark
- Subscribe
- Mute
- Printer Friendly Page
- Mark as New
- Bookmark
- Subscribe
- Mute
- Subscribe to RSS Feed
- Permalink
- Report Inappropriate Content
Color for expression
Hi Folks,
i have a question, can i give to my expressions (for instance i got 2 Expression and one Dimension) the coloring via variable.
my first Expression is Gesamtkosten and Colorexpression is RGB(249, 63, 23)
my second Expression is Leistungsstand and Colorexpression is RGB(90, 45, 79)
both Colorexpressions i saved in script.
my Dimension is Year.
in Qlik View i can give to each of my expression the colorexpression via variable. But how can i give the color expression via variable to every expression within my dashboard. in Tab: Appearance i tried to implement this settings but i did not solve this issue.
Does anybody have any idea?
thanks a lot
Beck
- Mark as New
- Bookmark
- Subscribe
- Mute
- Subscribe to RSS Feed
- Permalink
- Report Inappropriate Content
Hi beck,
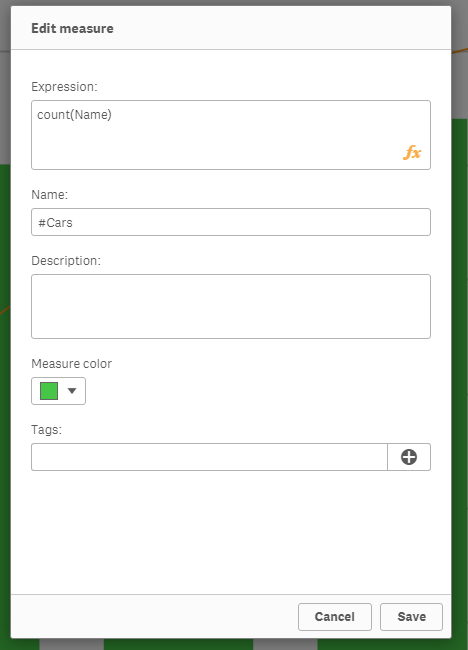
If you are using Qlik Sense 3.2 or later you can just add the expressions as measure to your library and then you can assign one color per measure. These colors are then used in the visualizations.
Best regards,
Patrik.
- Mark as New
- Bookmark
- Subscribe
- Mute
- Subscribe to RSS Feed
- Permalink
- Report Inappropriate Content
Hi Patrik,
thanks a lot for your feedback, i know this option, i used it in my app, but if you make copy of your app, these settings do not work.
At the beginning i was happy, but then i made a copy and gave it to my collegues to make further analysis, but these settings did not work. and if i pulish it in QMC, then i have the same situation, the settings of colloring do not work.
Do you have any ideas?
Beck
- Mark as New
- Bookmark
- Subscribe
- Mute
- Subscribe to RSS Feed
- Permalink
- Report Inappropriate Content
Hi beck,
Sounds odd. I'll make sure a dev/tester has a look.
Patrik.
- Mark as New
- Bookmark
- Subscribe
- Mute
- Subscribe to RSS Feed
- Permalink
- Report Inappropriate Content
Hi Patrick,
if you had a look, let please know, maybe i am missing something
Thanks a lot
Beck
- Mark as New
- Bookmark
- Subscribe
- Mute
- Subscribe to RSS Feed
- Permalink
- Report Inappropriate Content
Hi
See example attached I add 2 slides
Ones with color by expression using this procédure
Dimension :
Jarh_Monat
2nd dimension using value list dimension name is :
Type
=ValueList('Gesamtkosten','Leistungsstand')
then as mesure :
if(ValueList('Gesamtkosten','Leistungsstand')='Gesamtkosten',
sum(Gesamtkosten),
if(ValueList('Gesamtkosten','Leistungsstand')='Leistungsstand',
sum(Leistungsstand)))
and set color like this :
if(ValueList('Gesamtkosten','Leistungsstand')='Gesamtkosten',
RGB(249, 63, 23),
if(ValueList('Gesamtkosten','Leistungsstand')='Leistungsstand',
RGB(90, 45, 79)))
3rd slide use the same approch but this time I have added a variable named
vColorMesure
with this mesure :
if(ValueList('Gesamtkosten','Leistungsstand')='Gesamtkosten',
RGB(249, 63, 23),
if(ValueList('Gesamtkosten','Leistungsstand')='Leistungsstand',
RGB(90, 45, 79)))
And in the color panel a call the variable using
$(vColorMesure)
Regards
- Mark as New
- Bookmark
- Subscribe
- Mute
- Subscribe to RSS Feed
- Permalink
- Report Inappropriate Content
Hi Bruno,
Thanks a lot for your Help,
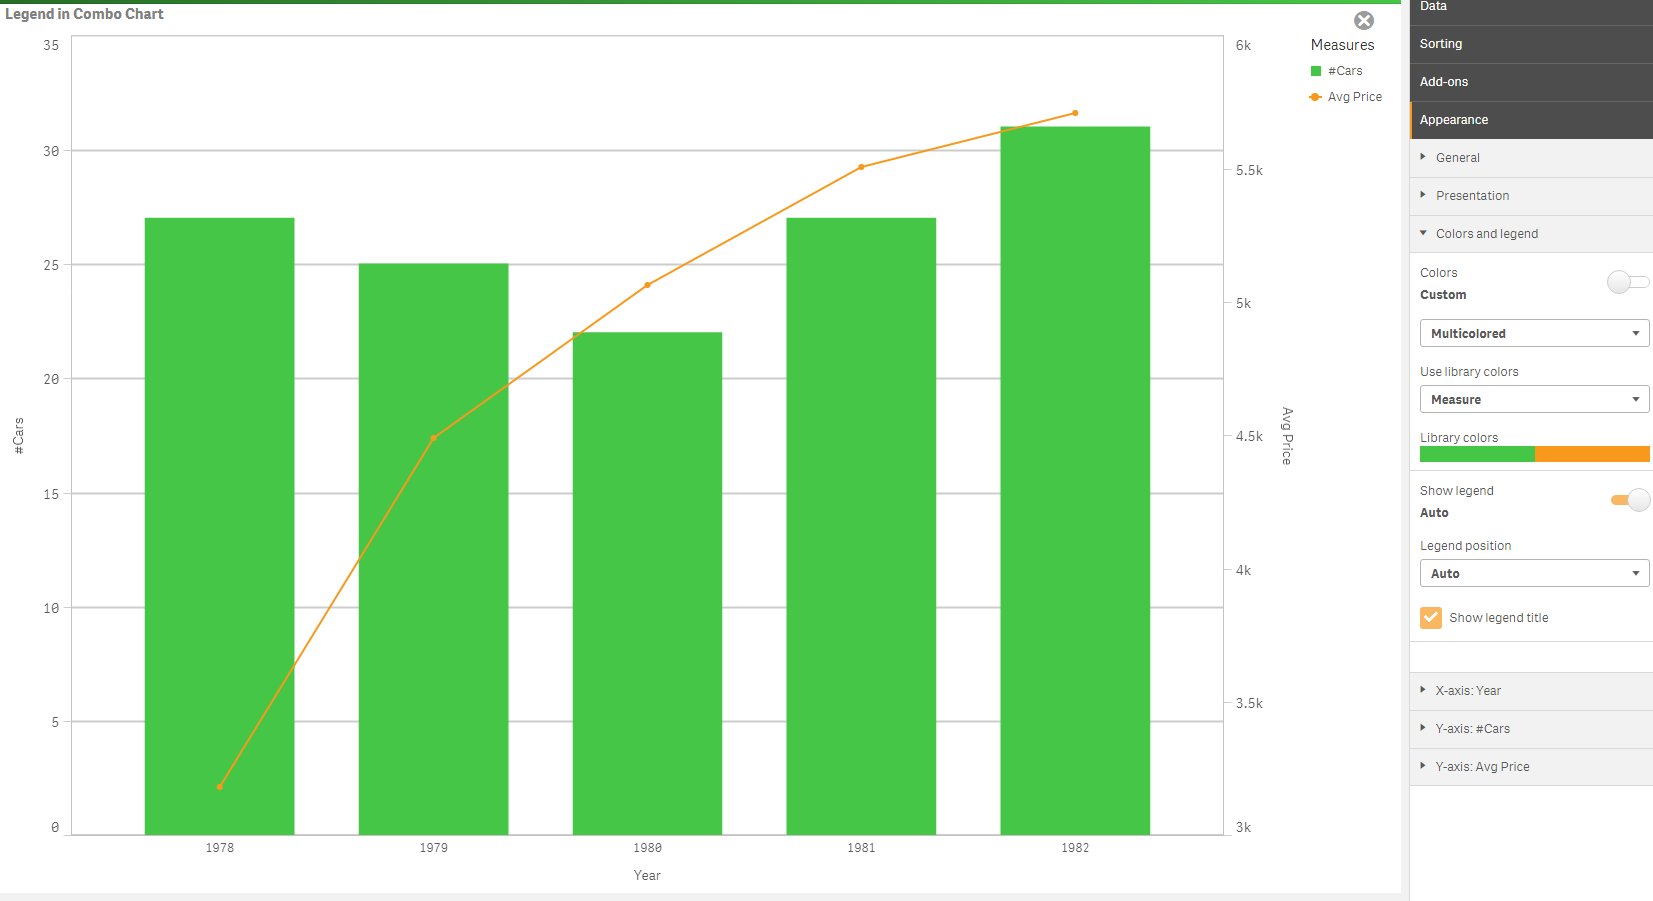
i got question, what if i use the combi-diagramm, one expression i want to see as bar, and another one i want to see as line-diagramm (see my screenshot).
it is possible to solve this issue on the base of above solutions
Thanks a lot
Beck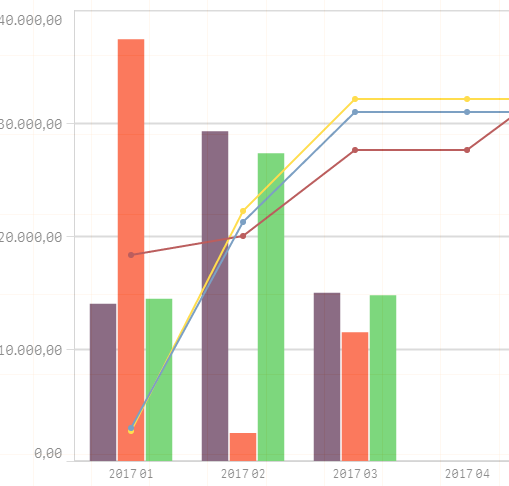
- Mark as New
- Bookmark
- Subscribe
- Mute
- Subscribe to RSS Feed
- Permalink
- Report Inappropriate Content
Hi
A far as i Know i dont think it is possible in a combo chart
but try this extension that's fully custumable
- Mark as New
- Bookmark
- Subscribe
- Mute
- Subscribe to RSS Feed
- Permalink
- Report Inappropriate Content
Bruno
Thanks a lot for your help,
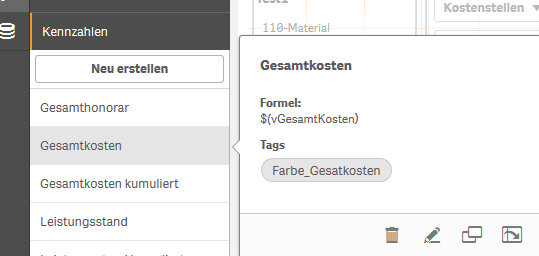
i got last question (please see attached screenshot) , on the base of screenshots i try to show my problem,
my color setting in my own app do work flawless, but if i publish my app, the color setting disappears.
Do you have any idea?
1.if i pilish my app in QMC
2. in my own app
Many Thanks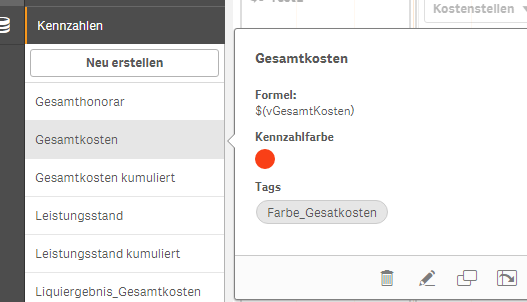
Beck
- Mark as New
- Bookmark
- Subscribe
- Mute
- Subscribe to RSS Feed
- Permalink
- Report Inappropriate Content
Hi
Not sure because i only use qliksense Desktop and not qliksense server but :
what version is install on your serveur ? because personal color for master mesure is only available with qlik sense 3.2 and not include in previous version
- Mark as New
- Bookmark
- Subscribe
- Mute
- Subscribe to RSS Feed
- Permalink
- Report Inappropriate Content
Hi Bruno,
as Desktop Version i am using the Version: Desktop June 2017
as QMC Version i have the following Version: Qlik Sense 3.0 SR 4
maybe i should update my QMC and the proble will be automatically solved.
What do you think about it?
Beck