Unlock a world of possibilities! Login now and discover the exclusive benefits awaiting you.
- Qlik Community
- :
- Forums
- :
- Analytics
- :
- New to Qlik Analytics
- :
- Colors, Labels and Legend for Stacked Chart
- Subscribe to RSS Feed
- Mark Topic as New
- Mark Topic as Read
- Float this Topic for Current User
- Bookmark
- Subscribe
- Mute
- Printer Friendly Page
- Mark as New
- Bookmark
- Subscribe
- Mute
- Subscribe to RSS Feed
- Permalink
- Report Inappropriate Content
Colors, Labels and Legend for Stacked Chart
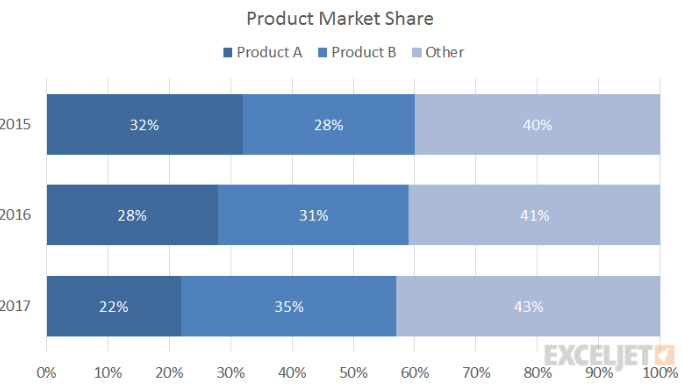
Hi, i have a fixed set of colors per product type that i need to use in the background and also have labels displayed on the color (product type or % figure), as well as the legend. The attached screenshot is an example.
Under Appearance > Colors and legend > By Expression, I have tried this expression:
If([Product Type] ='Product A',RGB(188,204,228),If([Product Type] ='Product B',RGB(148,180,212),If([Product Type] ='Other',RGB(52,100,148))
The above works in displaying the colors, but does not display the labels and the Legend next to the chart.
Could you please suggest an easy way to do fix the colors as well as display the labels and the legend. Much appreciated.
Thank you
Rachid
- Mark as New
- Bookmark
- Subscribe
- Mute
- Subscribe to RSS Feed
- Permalink
- Report Inappropriate Content
Just wondering if anyone had the chance to look into my query above please.
Thanks very much for the help.
- Mark as New
- Bookmark
- Subscribe
- Mute
- Subscribe to RSS Feed
- Permalink
- Report Inappropriate Content
Try with this extension
- Mark as New
- Bookmark
- Subscribe
- Mute
- Subscribe to RSS Feed
- Permalink
- Report Inappropriate Content
Thank you for the info. I was unfortunately not able to open that url link in the office. Any other suggestion please ?
- Mark as New
- Bookmark
- Subscribe
- Mute
- Subscribe to RSS Feed
- Permalink
- Report Inappropriate Content
I have checked AnyChart Qlik Extensions you suggested above, but I will not be able to use third party extensions at work.
Any other suggestion please how to work on this using qlik sense native extensions ?