Unlock a world of possibilities! Login now and discover the exclusive benefits awaiting you.
- Qlik Community
- :
- Forums
- :
- Analytics
- :
- New to Qlik Analytics
- :
- Re: Compare an amount for different years
- Subscribe to RSS Feed
- Mark Topic as New
- Mark Topic as Read
- Float this Topic for Current User
- Bookmark
- Subscribe
- Mute
- Printer Friendly Page
- Mark as New
- Bookmark
- Subscribe
- Mute
- Subscribe to RSS Feed
- Permalink
- Report Inappropriate Content
Compare an amount for different years
Hello everyone,
I would like to compare the sales amount for each of my customer for different years and be able to know if the sales amount for a customer in 2017 is upper or lower than in 2016.
For example, if one of my customer in 2016 had a sales amount of 1M€ and 950k€ in 2017 i would like to display the 2017 amount in red.
This should be done in a pivot table with my "Customers" and the "Years" as dimension and my "Sales Amount" as a measure
Don't hesitate to ask me further details if my explanation aren't enough clear.
Thanks in advance,
Florian
- « Previous Replies
-
- 1
- 2
- Next Replies »
- Mark as New
- Bookmark
- Subscribe
- Mute
- Subscribe to RSS Feed
- Permalink
- Report Inappropriate Content
can you share some sample data and a dummy output?
- Mark as New
- Bookmark
- Subscribe
- Mute
- Subscribe to RSS Feed
- Permalink
- Report Inappropriate Content
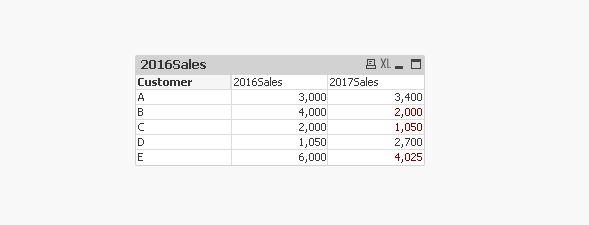
Sure,
Customer|Product|Year|SalesAmount,
A|Bike|2016|500,
A|Helmet|2016|500,
A|Bike|2017|400,
A|Helmet|2017|300,
B|Bike|2016|250,
B|Helmet|2016|200,
B|Bike|2017|300,
B|Helmet|2017|300,
In this example, I need to display for the customer A the sales amount for 2017 in red because the sum of sales amount for 2016 is upper than in 2017.
For the customer B, I need to display the sales amount for 2017 in green because the sum of sales amount for 2016 is lower than in 2016.
- Mark as New
- Bookmark
- Subscribe
- Mute
- Subscribe to RSS Feed
- Permalink
- Report Inappropriate Content
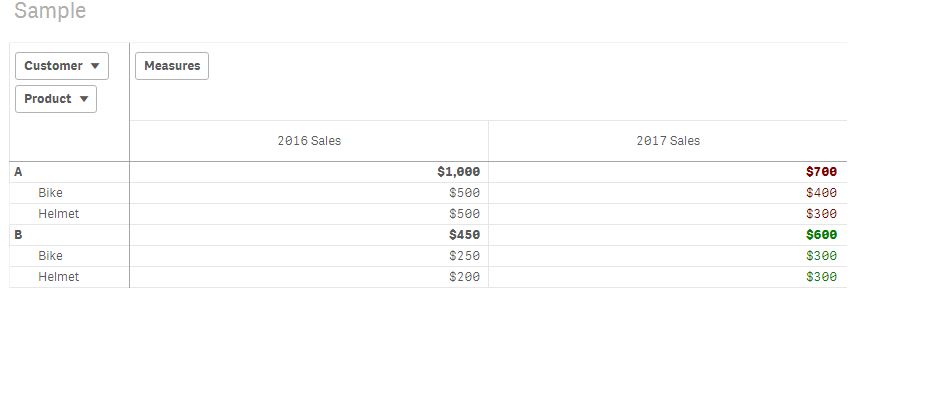
Hi,
Like this?
- Mark as New
- Bookmark
- Subscribe
- Mute
- Subscribe to RSS Feed
- Permalink
- Report Inappropriate Content
Yes, that's it
- Mark as New
- Bookmark
- Subscribe
- Mute
- Subscribe to RSS Feed
- Permalink
- Report Inappropriate Content
Hi,
PFA. Using your data (subfield function and qliksense version)
just use below text color expression like this
if( Column(1)>=Column(2),Red(),green())
if your issue got resolved, help to close this thread by marking as correct. thanks
- Mark as New
- Bookmark
- Subscribe
- Mute
- Subscribe to RSS Feed
- Permalink
- Report Inappropriate Content
Thanks Devarasu,
But unfortunately, this solution don't works if I have more than 2 Years.
Is it possible to do the same with 6 years? (From 2012 to 2017)
Thanks in advance
- Mark as New
- Bookmark
- Subscribe
- Mute
- Subscribe to RSS Feed
- Permalink
- Report Inappropriate Content
Hi,
Yes it can be done. u need to bucket year for each column then it should work. can you share your
mock data from 2012 to 2017 and expected output format.
- Mark as New
- Bookmark
- Subscribe
- Mute
- Subscribe to RSS Feed
- Permalink
- Report Inappropriate Content
Hi,
I'd like to do it for this kind of table.
What is the formula I should use ?
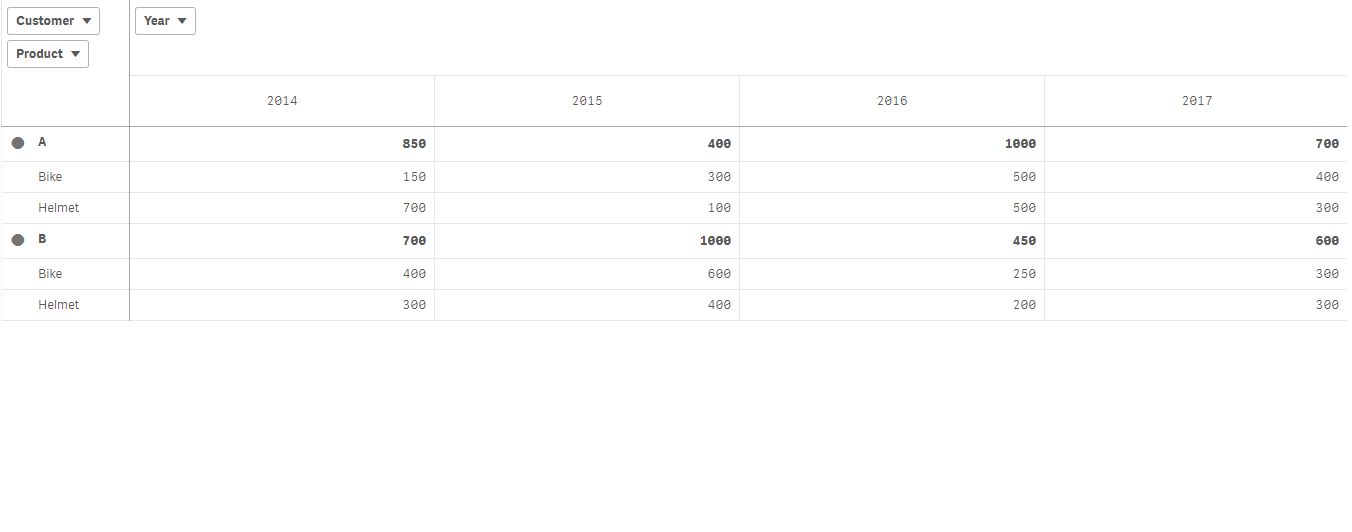
Test:
load * Inline [Customer,Product,Year,SalesAmount
A,Bike,2015,300
A,Helmet,2015,100
B,Helmet,2015,400
B,Bike,2015,600
A,Bike,2016,500,
A,Helmet,2016,500
A,Bike,2017,400
A,Helmet,2017,300
B,Bike,2016,250
B,Helmet,2016,200
B,Bike,2017,300
B,Helmet,2017,300
A,Bike,2014,150
A,Helmet,2014,700
B,Helmet,2014,300
B,Bike,2014,400
];
- Mark as New
- Bookmark
- Subscribe
- Mute
- Subscribe to RSS Feed
- Permalink
- Report Inappropriate Content
Hi,
how about your conditional color? expected output only in 2017 year or below rule can you confirm your expected result ?
if (current year > all the historical year , then red(), green())
or
2014 vs 2015
2015 vs 2016
2016 vs 2017?
- « Previous Replies
-
- 1
- 2
- Next Replies »