Unlock a world of possibilities! Login now and discover the exclusive benefits awaiting you.
- Qlik Community
- :
- Forums
- :
- Analytics
- :
- New to Qlik Analytics
- :
- Condition in expression
- Subscribe to RSS Feed
- Mark Topic as New
- Mark Topic as Read
- Float this Topic for Current User
- Bookmark
- Subscribe
- Mute
- Printer Friendly Page
- Mark as New
- Bookmark
- Subscribe
- Mute
- Subscribe to RSS Feed
- Permalink
- Report Inappropriate Content
Condition in expression
Hi
I need a little help
I have a data like this
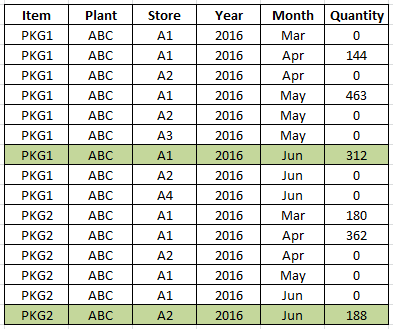
What i am trying to do is making expression for table chart in which i want quantity of last 2 months along with current selected month but only that row which has 0 quantity. And if there is a value in quantity column other than 0 then that row should not show.
I am using the below expression
Sum({$<Year=, Month=, monthyear={">=$(=MonthStart(AddMonths(Max(monthyear),-2)))<$(=MonthEnd(Max(monthyear)))"}, Quantity = {"0"} >} Quantity)
This expression is working fine for last months but not for current selected month. Like if i have select Year 2016 and Month Jun then data is showing like below snap
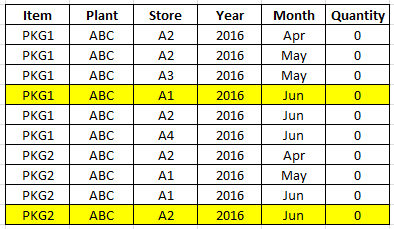
I don't want the highlighted row in the above image. This is the same row highlighted in green color in first image.
Rest of the result is perfectly fine. Only these two rows should not include in result.
How could i achieve this?
Thanks
- Mark as New
- Bookmark
- Subscribe
- Mute
- Subscribe to RSS Feed
- Permalink
- Report Inappropriate Content
Would you be able to share an app where you have already loaded the data or share the data in an Excel file? Also, you showed what you are getting, do you mind giving the exact numbers of what you expect to see as an output?