Unlock a world of possibilities! Login now and discover the exclusive benefits awaiting you.
- Qlik Community
- :
- Forums
- :
- Analytics
- :
- New to Qlik Analytics
- :
- Conditional Display on chart with two dimensions
- Subscribe to RSS Feed
- Mark Topic as New
- Mark Topic as Read
- Float this Topic for Current User
- Bookmark
- Subscribe
- Mute
- Printer Friendly Page
- Mark as New
- Bookmark
- Subscribe
- Mute
- Subscribe to RSS Feed
- Permalink
- Report Inappropriate Content
Conditional Display on chart with two dimensions
Hi all,
In Forecast app I've got conditional display so that the user can choose to display objects by Weighted or Unweighted data.
It goes like this:
in the script:
LOAD * INLINE [
AmountType, AmountTypeDes
1, Weighted
2, Unweighted
];
so the user can choose display by Filter Pane:
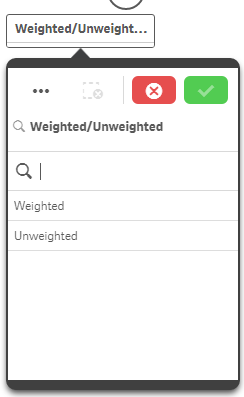
and in objects expression:
if(if(SubStringCount(Concat(AmountType,'|'), '1') =1,1,2)=1,sum(WeightedAmount),sum(UnweightedAmount))
NOW, this condition works just fine in most objects, BUT it's not working in Bar Chart with two dimensions.
For example, there is a "Region Amount by Year" Stacked Bar Chart with two dimensions: Year and Region, and the expression above.
but, it's only display sum(UnweightedAmount) values while it's not responding to display choice that made by the Filter Pane (Weighted/Unweighted).
Why so?
Thanks in advance,
Aviad
- Tags:
- conditional