Unlock a world of possibilities! Login now and discover the exclusive benefits awaiting you.
- Qlik Community
- :
- Forums
- :
- Analytics
- :
- New to Qlik Analytics
- :
- Re: Conditional in chart in sense
- Subscribe to RSS Feed
- Mark Topic as New
- Mark Topic as Read
- Float this Topic for Current User
- Bookmark
- Subscribe
- Mute
- Printer Friendly Page
- Mark as New
- Bookmark
- Subscribe
- Mute
- Subscribe to RSS Feed
- Permalink
- Report Inappropriate Content
Conditional in chart in sense
Hi expert, i would like to know if I can create condicional in sense as Qlikview when i create a chart
see the image attached, i want to put some conditional in some graph
thank you a lot
Fernando
Accepted Solutions
- Mark as New
- Bookmark
- Subscribe
- Mute
- Subscribe to RSS Feed
- Permalink
- Report Inappropriate Content
Hi Fernando,
I assume you referring to hiding / showing the expression in the graph based off of a defined condition, correct?
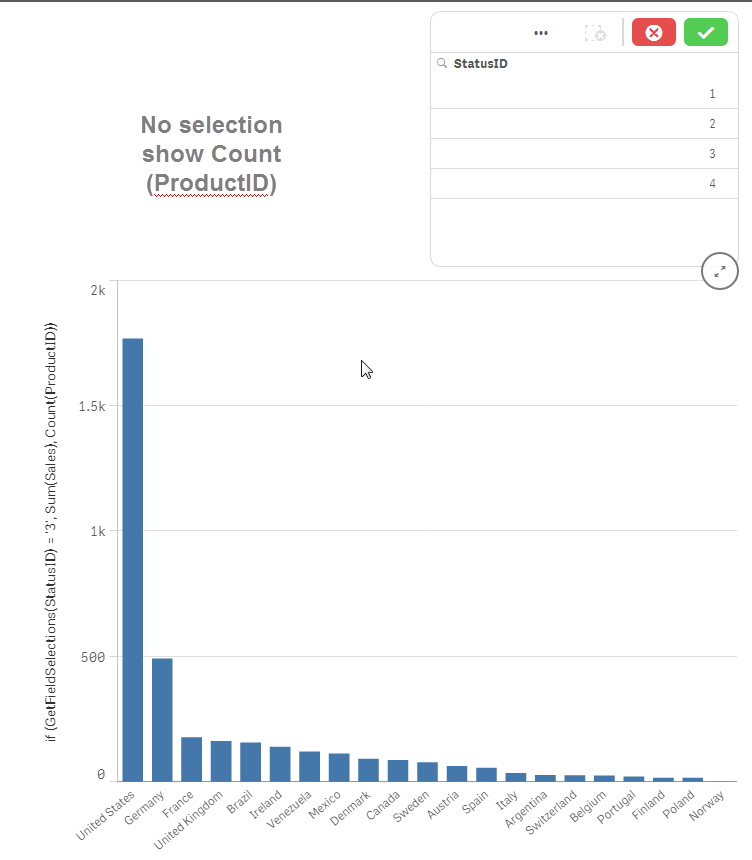
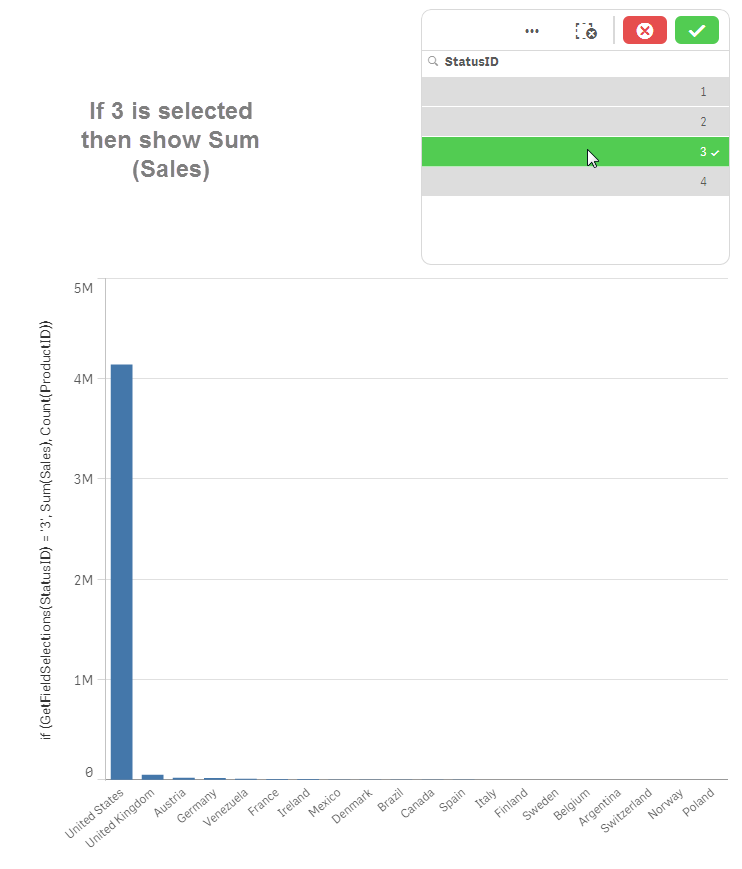
This is not an option in Qlik Sense - but you can define a measure expression for the chart object like this:
if (GetFieldSelections(StatusID) = '3', Sum(Sales), Count(ProductID))
See attached .qvf - Please copy .qvf file to your C:\Users\<user profile>\Documents\Qlik\Sense\Apps and refresh Qlik Sense Desktop with F5


NOTE: Please mark the appropriate replies as CORRECT / HELPFUL so our team and other members know that your question(s) has been answered to your satisfaction.
Regards,
Mike Tarallo
Qlik
Mike Tarallo
Qlik
- Mark as New
- Bookmark
- Subscribe
- Mute
- Subscribe to RSS Feed
- Permalink
- Report Inappropriate Content
Hi Fernando,
I assume you referring to hiding / showing the expression in the graph based off of a defined condition, correct?
This is not an option in Qlik Sense - but you can define a measure expression for the chart object like this:
if (GetFieldSelections(StatusID) = '3', Sum(Sales), Count(ProductID))
See attached .qvf - Please copy .qvf file to your C:\Users\<user profile>\Documents\Qlik\Sense\Apps and refresh Qlik Sense Desktop with F5


NOTE: Please mark the appropriate replies as CORRECT / HELPFUL so our team and other members know that your question(s) has been answered to your satisfaction.
Regards,
Mike Tarallo
Qlik
Mike Tarallo
Qlik
- Mark as New
- Bookmark
- Subscribe
- Mute
- Subscribe to RSS Feed
- Permalink
- Report Inappropriate Content
Excellent Mike!
As always, thank you a lot
Fernando
- Mark as New
- Bookmark
- Subscribe
- Mute
- Subscribe to RSS Feed
- Permalink
- Report Inappropriate Content
please try this i think it solved problem of conditional number formatting
num((if(vSelectionButton=1,Sum(expression1)
,if(vSelectionButton=2,Sum(expression1)
))),if(vSelectionButton=1,'$ #,##','#,##0.00'))
Reagrds,
Dixit Panchal