Unlock a world of possibilities! Login now and discover the exclusive benefits awaiting you.
- Qlik Community
- :
- Forums
- :
- Analytics
- :
- New to Qlik Analytics
- :
- Convert date rows into date columns
- Subscribe to RSS Feed
- Mark Topic as New
- Mark Topic as Read
- Float this Topic for Current User
- Bookmark
- Subscribe
- Mute
- Printer Friendly Page
- Mark as New
- Bookmark
- Subscribe
- Mute
- Subscribe to RSS Feed
- Permalink
- Report Inappropriate Content
Convert date rows into date columns
Hi folks,
I have a file with this structure (ignore dummy values):
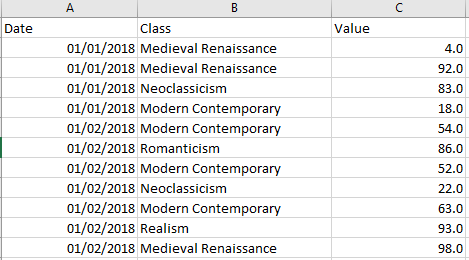
And I simply want to convert the Date rows into various columns (one column for each year-month) because I have the requirement to see the data in a table with this format. I cannot use Pivot Table because pivot table does an aggregation (the Totals rows) that, for this purpose, is not accurate.
I have tried the Generic Load but I'm not getting anything. I have to use a resident and preceding load with it and it keeps saying "Table 'myGenericTable' not found"
Any help?
Thanks!
Lisa
- « Previous Replies
-
- 1
- 2
- Next Replies »
Accepted Solutions
- Mark as New
- Bookmark
- Subscribe
- Mute
- Subscribe to RSS Feed
- Permalink
- Report Inappropriate Content
That is because you have two classes. Can't you delete the first?
- Mark as New
- Bookmark
- Subscribe
- Mute
- Subscribe to RSS Feed
- Permalink
- Report Inappropriate Content
Hi,
Can't you use a pivot table but instead of using a sum() calculation use an only() calculation? This way there should be no aggregation.
- Mark as New
- Bookmark
- Subscribe
- Mute
- Subscribe to RSS Feed
- Permalink
- Report Inappropriate Content
can u show us (create a simple mock table) with the output u desire?
- Mark as New
- Bookmark
- Subscribe
- Mute
- Subscribe to RSS Feed
- Permalink
- Report Inappropriate Content
Hi Niclas,
I don't see any option to define the aggregation in the pivot table. Not at the level of Measures.
I think it's a default behaviour of pivot tables.
- Mark as New
- Bookmark
- Subscribe
- Mute
- Subscribe to RSS Feed
- Permalink
- Report Inappropriate Content
Hi Omnar,
This would be the output table:
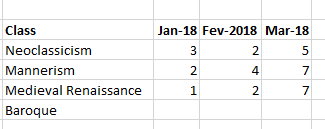
So, it's the opposite of a crosstable.
- Mark as New
- Bookmark
- Subscribe
- Mute
- Subscribe to RSS Feed
- Permalink
- Report Inappropriate Content
Hi Lisa,
Maybe do the following, add this line to your script:
Year(Date) & '|' & Month(Date) as YrMth
Make a pivot table in Qlik Sense
Dimensions:
Row
Class
Column
YrMth
Measures:
Count(Class)
With this, you will get the same as in your example.
- Mark as New
- Bookmark
- Subscribe
- Mute
- Subscribe to RSS Feed
- Permalink
- Report Inappropriate Content
Hi Jordy,
What are you doing to the 'Value' column? This is, the numbers I want to populate the table with. You are doing Count(Class).
- Mark as New
- Bookmark
- Subscribe
- Mute
- Subscribe to RSS Feed
- Permalink
- Report Inappropriate Content
Hi Lisa,
Then you can do Sum(Value), because I thought you were counting the amount of classes in a certain month.
- Mark as New
- Bookmark
- Subscribe
- Mute
- Subscribe to RSS Feed
- Permalink
- Report Inappropriate Content
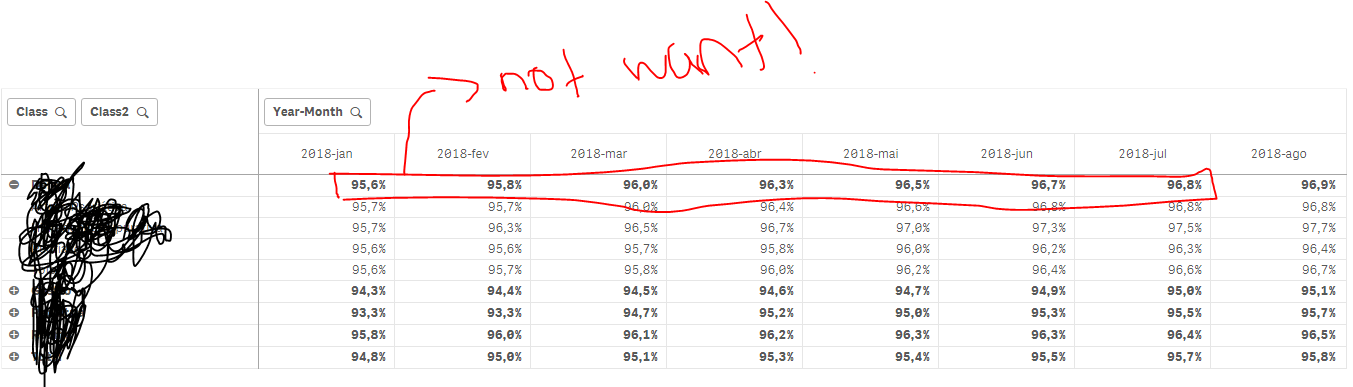
Hi Jordy,
No, the values are a pre-calculated value from the file. They are percentages, so instead of sum() I have avg(), but in a pivot table I don't want to see the total avg(). This is the only problem I have with the pivot table. Do you know how can I fix that?
Thanks!
- Mark as New
- Bookmark
- Subscribe
- Mute
- Subscribe to RSS Feed
- Permalink
- Report Inappropriate Content
Can you provide a sample?
You have %'s pre calculated in your data?
- « Previous Replies
-
- 1
- 2
- Next Replies »