Unlock a world of possibilities! Login now and discover the exclusive benefits awaiting you.
- Qlik Community
- :
- Forums
- :
- Analytics
- :
- New to Qlik Analytics
- :
- Re: Count Of fields Having Max ID
- Subscribe to RSS Feed
- Mark Topic as New
- Mark Topic as Read
- Float this Topic for Current User
- Bookmark
- Subscribe
- Mute
- Printer Friendly Page
- Mark as New
- Bookmark
- Subscribe
- Mute
- Subscribe to RSS Feed
- Permalink
- Report Inappropriate Content
Count Of fields Having Max ID
Hello one and all,
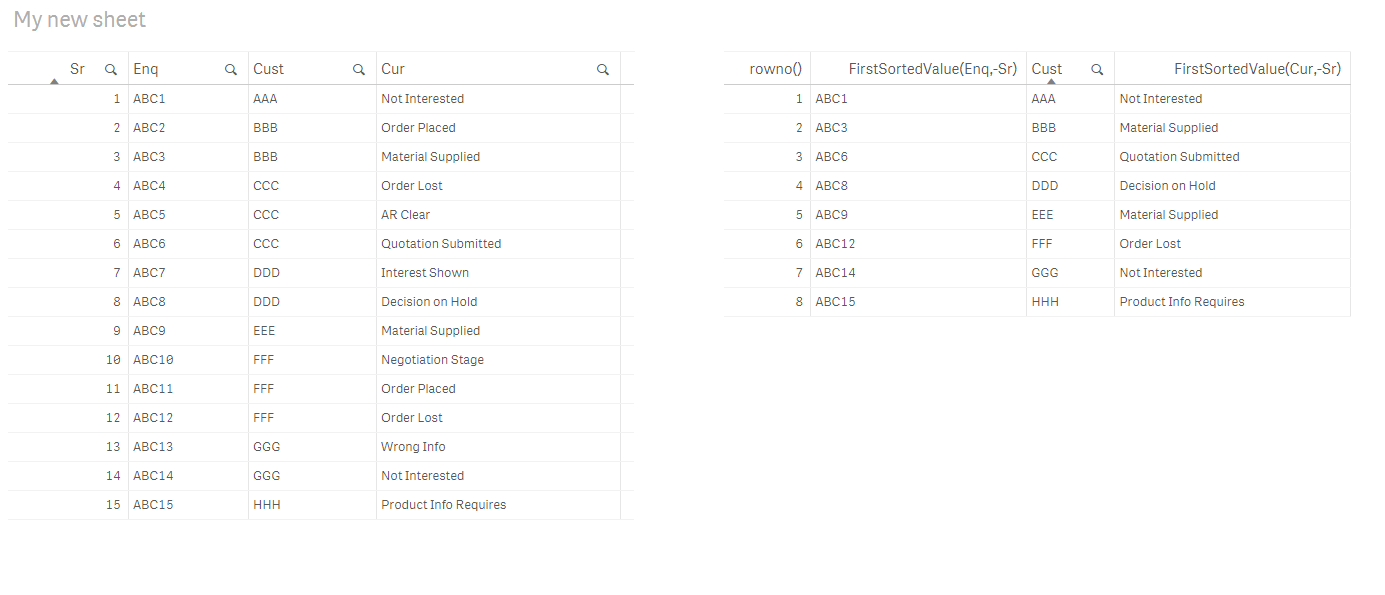
I have The following table
Sr No Enquiry Id Customer Id Current Action
1 ABC1 AAA Not Interested
2 ABC2 BBB Order Placed
3 ABC3 BBB Material Supplied
4 ABC4 CCC Order Lost
5 ABC5 CCC AR Clear
6 ABC6 CCC Quotation Submitted
7 ABC7 DDD Interest Shown
8 ABC8 DDD Decision on Hold
9 ABC9 EEE Material Supplied
10 ABC10 FFF Negotiation Stage
11 ABC11 FFF Order Placed
12 ABC12 FFF Order Lost
13 ABC13 GGG Wrong Info
14 ABC14 GGG Not Interested
15 ABC15 HHH Product Info Requires
I want a Table As Follows:
Sr No Enquiry Id Customer Id Current Action
1 ABC1 AAA Not Interested
2 ABC3 BBB Material Supplied
3 ABC6 CCC Quotation Submitted
4 ABC8 DDD Decision on Hold
5 ABC9 EEE Material Supplied
6 ABC12 FFF Order Lost
7 ABC14 GGG Not Interested
8 ABC15 HHH Product Info Requires
I just want the last current action to be displayed taking the Max Value of the Enquiry Id
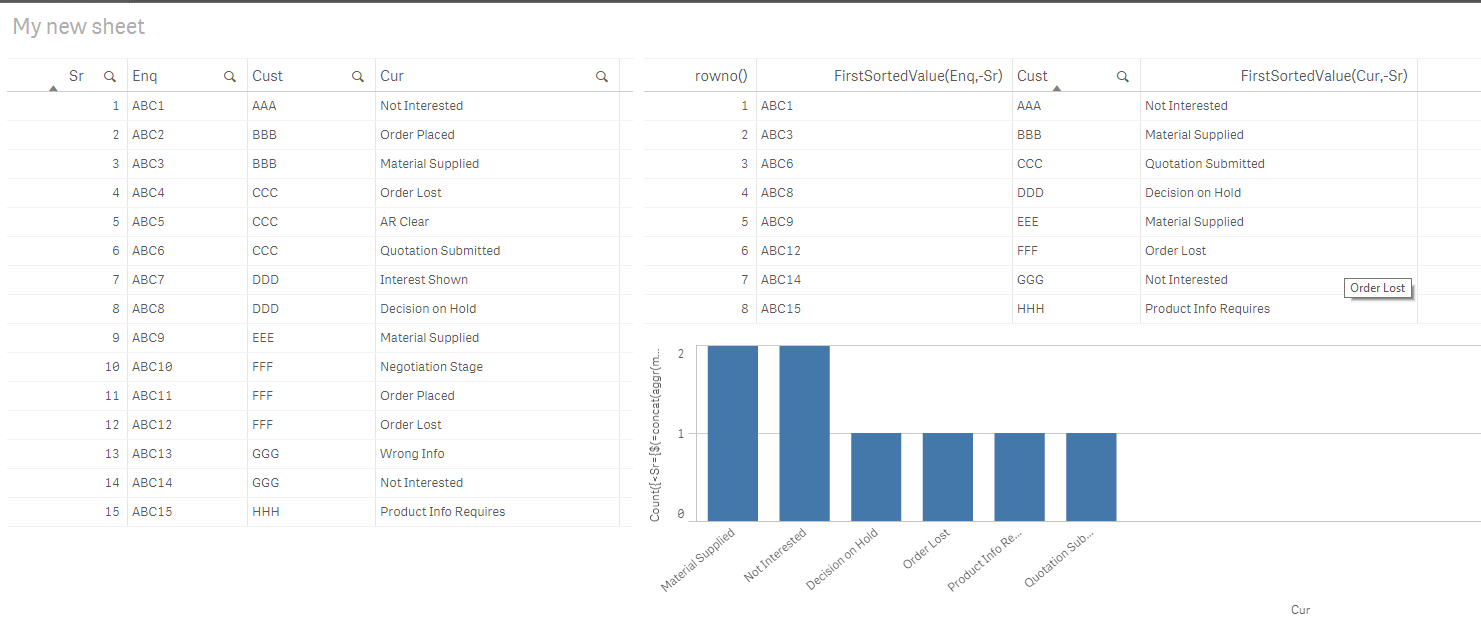
Also let me know if a Bar Chart for the same can be created as well . I want the Dimension as Current Action and the Measure as Count(Distinct Customer Id) Where Enquiry Id to be max (Enquiry Id)
Thank You in advance.
- « Previous Replies
-
- 1
- 2
- Next Replies »
- Mark as New
- Bookmark
- Subscribe
- Mute
- Subscribe to RSS Feed
- Permalink
- Report Inappropriate Content
You can use FirstSortedValue() if your data properly sorted.
Table :
Column 1 (Measure) : Rowno()
Column 2 (Measure) : FirstSortedValue("Enquiry Id",-"Sr No")
Column 3 (Dimension) : "Customer Id"
Column 4 (Measure) : FirstSortedValue("Current Action",-"Sr No")

- Mark as New
- Bookmark
- Subscribe
- Mute
- Subscribe to RSS Feed
- Permalink
- Report Inappropriate Content
Thanks a Lot. It works like a charm.
Now Could You please help me with the Bar Graph Part of it .
I want the Current Action As Dimension and Count(Customer Id) as Measure
- Mark as New
- Bookmark
- Subscribe
- Mute
- Subscribe to RSS Feed
- Permalink
- Report Inappropriate Content
Glad to hear that ![]()
First of all, please mark the entry as CORRECT. This will help community members to find possible solutions easily
Bar Chart,
Dimension : "Current Action"
Measure : Count({<"Sr No"={$(=concat(aggr(max("Sr No"),"Customer Id"),','))}>} "Customer Id")

- Mark as New
- Bookmark
- Subscribe
- Mute
- Subscribe to RSS Feed
- Permalink
- Report Inappropriate Content
TABLE:
load * inline [
Sr No , Enquiry Id , Customer Id , Current Action,
1 , ABC1, AAA , Not Interested
2 , ABC2 , BBB , Order Placed
3 , ABC3 , BBB , Material Supplied
4 , ABC4 , CCC , Order Lost
5 , ABC5 , CCC , AR Clear
6 , ABC6 , CCC , Quotation Submitted
7 , ABC7 , DDD , Interest Shown
8 , ABC8 , DDD , Decision on Hold
9 , ABC9 , EEE , Material Supplied
10 , ABC10 , FFF , Negotiation Stage
11 , ABC11 , FFF , Order Placed
12 , ABC12 , FFF , Order Lost
13 , ABC13 , GGG , Wrong Info
14 , ABC14 , GGG , Not Interested
15 , ABC15 , HHH , Product Info Requires
];
maptable:
mapping
load "Customer Id"&'-'&max as Key,RowNo() as row;
load "Customer Id",max(NUM#(PurgeChar("Enquiry Id",'ABC'))) as max resident TABLE GROUP BY "Customer Id";
load*,
ApplyMap('maptable',
"Customer Id"&'-'&NUM#(PurgeChar("Enquiry Id",'ABC')),null()) as "Sr n01" resident TABLE;
drop table TABLE;
- Mark as New
- Bookmark
- Subscribe
- Mute
- Subscribe to RSS Feed
- Permalink
- Report Inappropriate Content
Thanks a lot. Even the Bar Graph is working Perfectly fine .
Thanks once again. Cheers mate
- Mark as New
- Bookmark
- Subscribe
- Mute
- Subscribe to RSS Feed
- Permalink
- Report Inappropriate Content
As an extra advice, it is better to handle this kind of needs in script side for better performance. You can flag the records that you need
For example:
temp_table:
load * Inline [
"Sr","Enq","Cust","Cur"
1,'ABC1','AAA','Not Interested'
2,'ABC2','BBB','Order Placed'
3,'ABC3','BBB','Material Supplied'
4,'ABC4','CCC','Order Lost'
5,'ABC5','CCC','AR Clear'
6,'ABC6','CCC','Quotation Submitted'
7,'ABC7','DDD','Interest Shown'
8,'ABC8','DDD','Decision on Hold'
9,'ABC9','EEE','Material Supplied'
10,'ABC10','FFF','Negotiation Stage'
11,'ABC11','FFF','Order Placed'
12,'ABC12','FFF','Order Lost'
13,'ABC13','GGG','Wrong Info'
14,'ABC14','GGG','Not Interested'
15,'ABC15','HHH','Product Info Requires'
table:
load *,
IF(Cust<>peek(Cust,RecNo(),'temp_table'),1,0) as LastOccFlag
Resident temp_table;
drop table temp_table;
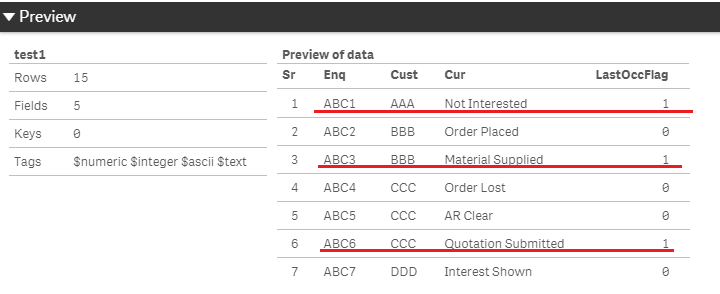
result will be:

Then you can use this flag on calculations.
you can use count({<LastOccFlag={1}>} "Customer Id") instead of Count({<"Sr No"={$(=concat(aggr(max("Sr No"),"Customer Id"),','))}>} "Customer Id") for the bar chart that you already did.
- Mark as New
- Bookmark
- Subscribe
- Mute
- Subscribe to RSS Feed
- Permalink
- Report Inappropriate Content
But if there are large sets of data, say 100,000 rows of data, then using Inline Load will not be practical right ???
- Mark as New
- Bookmark
- Subscribe
- Mute
- Subscribe to RSS Feed
- Permalink
- Report Inappropriate Content
Of course, you should load the table from the source. We use inline for creating a sample data because we don't know your actual data.
For example;
temp_table:
load *;
sql select
"Sr No",
"Enquiry Id",
"Customer Id ",
"Current Action"
from sourceTable;
table:
load *,
IF(Cust<>peek(Cust,RecNo(),'temp_table'),1,0) as LastOccFlag
Resident temp_table;
drop table temp_table;
- Mark as New
- Bookmark
- Subscribe
- Mute
- Subscribe to RSS Feed
- Permalink
- Report Inappropriate Content
Thanks a lot. Will definitely consider using it
- Mark as New
- Bookmark
- Subscribe
- Mute
- Subscribe to RSS Feed
- Permalink
- Report Inappropriate Content
Hi
Actually It Shows the correct count when on display, but however when you are selecting a particular dimension, then the count increases because it even takes the count that doesn't have a max [Sr No].
For Example the Graph shows [Order Lost] count as 1, but if you click on it the count increases to 2. This is because it even takes [Customer Id] CCC's [Order Lost] into consideration. So I did the necessary change in the equation and then the answer comes correct
The correct Expression is as follows
Count({<"Sr No"={ $(=Concat(aggr(max({1}"Sr No"),[Customer Id]),','))}>}"Customer Id")
- « Previous Replies
-
- 1
- 2
- Next Replies »