Unlock a world of possibilities! Login now and discover the exclusive benefits awaiting you.
- Qlik Community
- :
- Forums
- :
- Analytics
- :
- New to Qlik Analytics
- :
- Re: Count/Sum Missing steps using a bar chart
- Subscribe to RSS Feed
- Mark Topic as New
- Mark Topic as Read
- Float this Topic for Current User
- Bookmark
- Subscribe
- Mute
- Printer Friendly Page
- Mark as New
- Bookmark
- Subscribe
- Mute
- Subscribe to RSS Feed
- Permalink
- Report Inappropriate Content
Count/Sum Missing steps using a bar chart
Hi guys,
This is the most complicated query I came across, can anyone please help?
Question:
Every candidate must follow this sequence of steps to get recruited by a company
1. Apply for Job
2. Pass the Exam
3. Interview
4. Sign the Offer Letter
5. Background Check
Some of the candidates don't reach the final step and may never get a job.
Some candidates reach the final step but might have some missing steps in between.
(Like Kyle got a job but he didn't go through the 'Pass the Exam' step so I'll count 1 missing step here.
Similary Jack never made it to the last step, he couldn't pass the exam, so we won't consider any missing steps for him.
For King, the last step was 'Sign the Offer Letter', but he has a missing step, he didn't go through
interview, so we will count that as 1)
So basically, for any of the candidates whatever be the last step, they shouldn't have any missing steps in between.
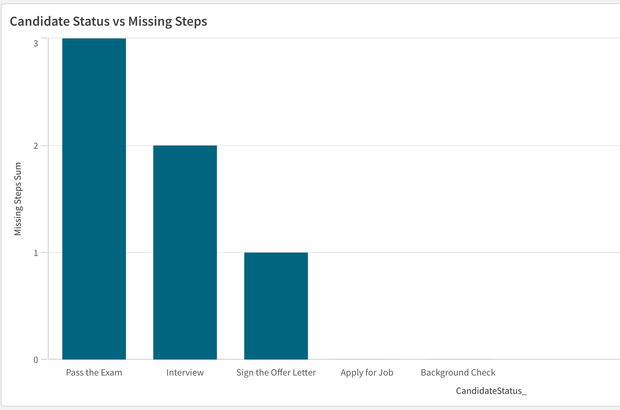
Now, I want to take the count of missing step and present it using a bar chart. Can anyone help please?
It's the most complicated query I came across so far.
Sample Data:
Load * inline
[
Date, CandidateName, CandidateStatus, Counter
1/1/2020 ,Dan, Apply for Job, 1
1/3/2020 ,Dan, Pass the Exam, 1
1/5/2020 ,Dan, Interview, 1
1/7/2020 ,Dan, Sign the Offer Letter, 1
1/9/2020 ,Dan, Background Check, 1
2/1/2020 ,Kyle, Apply for Job, 1
2/5/2020 ,Kyle, Interview, 1
2/7/2020 ,Kyle, Sign the Offer Letter, 1
2/8/2020 ,Kyle, Background Check, 1
1/9/2020 ,Jack, Apply for Job, 1
2/8/2020 ,King, Apply for Job, 1
2/9/2020 ,King, Pass the Exam, 1
2/11/2020 ,King, Sign the Offer Letter, 1
3/11/2020 ,Steve, Apply for Job, 1
4/11/2020 ,Steve, Interview, 1
5/11/2020 ,Ray, Apply for Job, 1
6/11/2020 ,Ray, Background Check, 1
];
Output:
Thank you so much.
@QFabian @MayilVahanan @rwunderlich @Kushal_Chawda @Taoufiq_Zarra
- « Previous Replies
-
- 1
- 2
- Next Replies »
- Mark as New
- Bookmark
- Subscribe
- Mute
- Subscribe to RSS Feed
- Permalink
- Report Inappropriate Content
since you are using aggregates, just count distinct applicants and that will be your baseline.
#Applicants - count of each step = missing for each step.
assuming a chart with Status as dimension
expression = count(distinct total CandidateName) - count(distinct Candidate)
- Mark as New
- Bookmark
- Subscribe
- Mute
- Subscribe to RSS Feed
- Permalink
- Report Inappropriate Content
another style is create a variable that stores the number of candidates and use that variable in the expression
- Mark as New
- Bookmark
- Subscribe
- Mute
- Subscribe to RSS Feed
- Permalink
- Report Inappropriate Content
- Mark as New
- Bookmark
- Subscribe
- Mute
- Subscribe to RSS Feed
- Permalink
- Report Inappropriate Content
Can you share a qvw/qvf?
That didn't give me anyting. @edwin
- Mark as New
- Bookmark
- Subscribe
- Mute
- Subscribe to RSS Feed
- Permalink
- Report Inappropriate Content
SampleData:

Load * inline [
Date, CandidateName, CandidateStatus, Counter
1/1/2020 ,Dan, Apply for Job, 1
1/3/2020 ,Dan, Pass the Exam, 1
1/5/2020 ,Dan, Interview, 1
1/7/2020 ,Dan, Sign the Offer Letter, 1
1/9/2020 ,Dan, Background Check, 1
2/1/2020 ,Kyle, Apply for Job, 1
2/5/2020 ,Kyle, Interview, 1
2/7/2020 ,Kyle, Sign the Offer Letter, 1
2/8/2020 ,Kyle, Background Check, 1
1/9/2020 ,Jack, Apply for Job, 1
2/8/2020 ,King, Apply for Job, 1
2/9/2020 ,King, Pass the Exam, 1
2/11/2020 ,King, Sign the Offer Letter, 1
3/11/2020 ,Steve, Apply for Job, 1
4/11/2020 ,Steve, Interview, 1
5/11/2020 ,Ray, Apply for Job, 1
6/11/2020 ,Ray, Background Check, 1
];
with no change to your script. this is the resulting straight table:
shows how many candidates missed a specific step
- Mark as New
- Bookmark
- Subscribe
- Mute
- Subscribe to RSS Feed
- Permalink
- Report Inappropriate Content
| CandidateStatus | COUNT(distinct total CandidateName) - COUNT(distinct CandidateName) |
| Background Check | 3 |
| Interview | 3 |
| Pass the Exam | 4 |
| Sign the Offer Letter | 3 |
- Mark as New
- Bookmark
- Subscribe
- Mute
- Subscribe to RSS Feed
- Permalink
- Report Inappropriate Content
I have to take a count of the missing steps, not candidates.
Whenever (for instance Interview/Pass the exam etc. is missing for a candidate, count it as 1)
- Mark as New
- Bookmark
- Subscribe
- Mute
- Subscribe to RSS Feed
- Permalink
- Report Inappropriate Content
so that means you count all the missing steps for one candidate as 1. but is it one per step? from your example if a candidate missed Interview and Pass the Exam and they are both counted as 1, how will you chart that? shouldnt it be charted as follows?
interview - 1
pass exam - 1
- Mark as New
- Bookmark
- Subscribe
- Mute
- Subscribe to RSS Feed
- Permalink
- Report Inappropriate Content
I'm not considering candidate anywhere.
It's just the sum of missing steps (no matter what the candidate was)
- « Previous Replies
-
- 1
- 2
- Next Replies »
