Unlock a world of possibilities! Login now and discover the exclusive benefits awaiting you.
- Qlik Community
- :
- Forums
- :
- Analytics
- :
- New to Qlik Analytics
- :
- Re: Count and Group By In Bar Chart
- Subscribe to RSS Feed
- Mark Topic as New
- Mark Topic as Read
- Float this Topic for Current User
- Bookmark
- Subscribe
- Mute
- Printer Friendly Page
- Mark as New
- Bookmark
- Subscribe
- Mute
- Subscribe to RSS Feed
- Permalink
- Report Inappropriate Content
Count and Group By In Bar Chart
Hi All,
I faced a problem,
I had a table like this
Name|Division|Month|Result
A|A1|May2020|AC
A|A2|May2020|AC
A|A3|May2020|AC
A|A4|May2020|AC
A|A1|May2020|NC
B|B1|June2020|AC
B|B1|June2020|AC
B|B2|June2020|NC
B|B3|June2020|AC
I want to make a bar chart that I can Count(Result) and Grouping By Name, Result and Grouping By Name, Month, Result
But now I only can make bar chart count(result) and count(result) of each Name was same value and cannot Grouping By Name, Result and Grouping By Name, Month, Result
Please show me the way, thanks before.
- Mark as New
- Bookmark
- Subscribe
- Mute
- Subscribe to RSS Feed
- Permalink
- Report Inappropriate Content
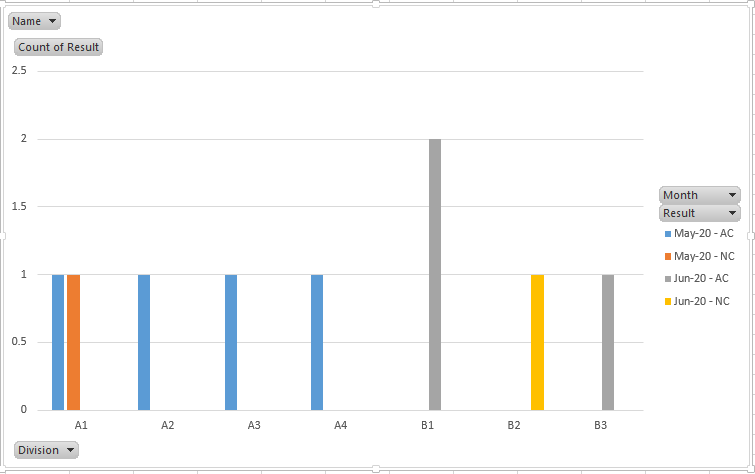
You may run into limitations with this approach, but you could try creating a calculated dimension that combines name and result.
Either in the data load script or as a calculated dimension create a field that combines Name and Result.
=Name&'|'&Result
Create a bar chart with 2 dimensions (the maximum allowed) Month, and NameResult field.
The measure will be count(result)
Stacked:

Grouped:

Also if the Month field is just a string, you can convert it to a date so it sorts correctly
=date(makedate(num(right(Month,4)),month(date#(left(Month,len(Month)-4),'MMMM')),1),'MMM YYYY')

Alternatively, perhaps leverage a different approach of having two bar charts side by side leveraging the interactive capabilities of Qlik Sense so users could select what they wanted to see.
*if the requirements are flexible enough.
- count(result), grouped by Month, Name
- count(result), grouped by Month, Result
More on bar charts in Qlik Sense:
https://help.qlik.com/en-US/sense/latest/Subsystems/Hub/Content/Sense_Hub/Visualizations/Bar-Chart/b...