Unlock a world of possibilities! Login now and discover the exclusive benefits awaiting you.
- Qlik Community
- :
- Forums
- :
- Analytics
- :
- New to Qlik Analytics
- :
- Re: Create tables from Existing tables
- Subscribe to RSS Feed
- Mark Topic as New
- Mark Topic as Read
- Float this Topic for Current User
- Bookmark
- Subscribe
- Mute
- Printer Friendly Page
- Mark as New
- Bookmark
- Subscribe
- Mute
- Subscribe to RSS Feed
- Permalink
- Report Inappropriate Content
Create tables from Existing tables
Hi,
I have a question which can be very simple to many experts here. Can you please help me with taking daily data from one base QVD and do last 'n' number of days sum and store in a new QVD table.
Here is an example.
dailytable:
Date Count 1 Count 2 Count 3
01-01-2017 30 40 60
01-02-2017 10 10 70
01-03-2017 40 50 30
01-04-2017 60 20 20
01-05-2017 20 20 40
01-06-2017 60 50 30
01-07-2017 20 60 40
01-08-2017 60 20 20
01-09-2017 10 50 10
01-10-2017 60 30 10
01-11-2017 20 20 30
I want to create new 7 days and cumulative tables from basetable by adding last 7 days data with out using RangeSum.
weeklysumtable:
Date 7Count 1 7Count 2 7Count 3
01-01-2017 30 40 60
01-02-2017 40 50 130
01-03-2017 80 100 160
01-04-2017 140 120 180
01-05-2017 160 140 220
01-06-2017 220 190 250
01-07-2017 240 250 290 (one week added 1-7 data from daily table)
01-08-2017 270 230 250 (one week added 2-8 data from daily table)
01-09-2017 270 270 190 (one week added 3-9 data from daily table)
01-10-2017 290 250 170 (one week added 4-10 data from daily table)
01-11-2017 250 250 180 (one week added 5-11 data from daily table)
Like this add up only last seven days and display the data on every day. How can I do it from loading a QVD file to Save it in new QVD. Please guide me. Thanks for the help!
- « Previous Replies
-
- 1
- 2
- Next Replies »
- Mark as New
- Bookmark
- Subscribe
- Mute
- Subscribe to RSS Feed
- Permalink
- Report Inappropriate Content
Hi Chaitanya,
Attached the alternate solution for Range Sum.
Check in the cumulative value in the expression tab and input the number you wish to accumulate to.
Many Thanks
Karthik
- Mark as New
- Bookmark
- Subscribe
- Mute
- Subscribe to RSS Feed
- Permalink
- Report Inappropriate Content
Hi,
Script code
dailytable:
Load*,
RecNo() as ID,
RangeSum([Count 1], peek('SumCount1')) as SumCount1,
RangeSum([Count 2], peek('SumCount2')) as SumCount2,
RangeSum([Count 3], peek('SumCount3')) as SumCount3;
Load*Inline
[Date, Count 1, Count 2, Count 3
01-01-2017, 30, 40, 60
01-02-2017, 10, 10, 70
01-03-2017, 40, 50, 30
01-04-2017, 60, 20, 20
01-05-2017, 20, 20, 40
01-06-2017, 60, 50, 30
01-07-2017, 20, 60, 40
01-08-2017, 60, 20, 20
01-09-2017, 10, 50, 10
01-10-2017, 60, 30, 10
01-11-2017, 20, 20, 30
];
Left Join
Load*,
If(ID<=7, SumCount1, SumCount1 - Peek(SumCount1, -7)) as Count1_7,
If(ID<=7, SumCount2, SumCount2 - Peek(SumCount2, -7)) as Count2_7,
If(ID<=7, SumCount3, SumCount3 - Peek(SumCount3, -7)) as Count3_7
Resident dailytable;
Drop Fields ID, [Count 1], [Count 2], [Count 3], SumCount1, SumCount2, SumCount3;
Result
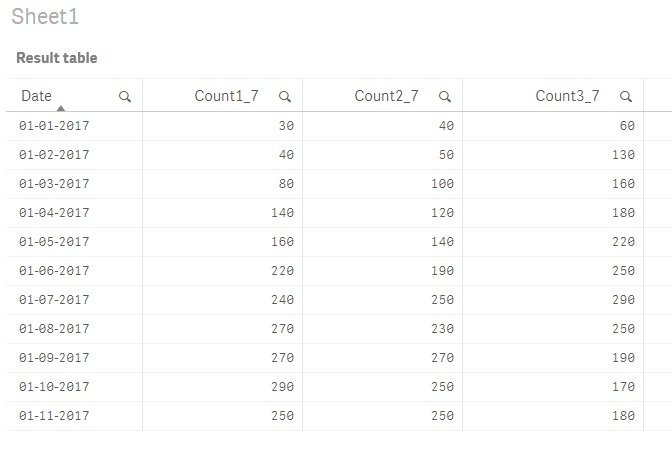
Example in attached file.
Regards,
Andrey
- Mark as New
- Bookmark
- Subscribe
- Mute
- Subscribe to RSS Feed
- Permalink
- Report Inappropriate Content
This is about Qlik Sense. But thanks though!
- Mark as New
- Bookmark
- Subscribe
- Mute
- Subscribe to RSS Feed
- Permalink
- Report Inappropriate Content
I am trying here is the code:
Load *,
RecNo() as ID,
RangeSum([success_event], peek(Sumsuccess_event)) as Sumsuccess_event,
RangeSum([failure_event], peek(Sumfailure_event)) as Sumfailure_event
FROM [lib://Inappmain (qlik-prod_admin1)/event_app.qvd]
(qvd);
Left Join
Load *,
If(ID<=7, Sumsuccess_event, Sumsuccess_event - Peek(Sumsuccess_event, -7)) as Weekly_SuccessEvent,
If(ID<=7, Sumfailure_event, Sumfailure_event - Peek(Sumfailure_event, -7)) as Weekly_FailureEvent
Resident dailytable;
Drop Fields ID, success_event, failure_event, Sumsuccess_event, Sumfailure_event;
but when I do the calculation it does not match:
Here is the table which I am trying to load from:
LOAD
"date",
network,
click_event,
success_event,
failure_event,
FROM [lib://Inappmain (qlik-prod_admin1)/event_app.qvd]
(qvd);
You are almost near to nail this, I am eagerly waiting for your reply. Thanks.
- Mark as New
- Bookmark
- Subscribe
- Mute
- Subscribe to RSS Feed
- Permalink
- Report Inappropriate Content
Need an ORDER BY in your original LOAD to make sure its in the order you want when "Peeking".
- Mark as New
- Bookmark
- Subscribe
- Mute
- Subscribe to RSS Feed
- Permalink
- Report Inappropriate Content
LOAD
"date",
network,
click_event,
success_event,
failure_event,
FROM [lib://Inappmain (qlik-prod_admin1)/event_app.qvd]
(qvd)
ORDER BY "date";
See Online Help for LOAD
Without an explicit ORDER BY, the data is loaded in natural order, not knowing your source, it may not be by date.
- Mark as New
- Bookmark
- Subscribe
- Mute
- Subscribe to RSS Feed
- Permalink
- Report Inappropriate Content
I am sorry let me take a step back:
dailytable:
Date Click_event Success_event Failure_event
01-01-2017 30 40 60
01-02-2017 10 10 70
01-03-2017 40 50 30
01-04-2017 60 20 20
01-05-2017 20 20 40
01-06-2017 60 50 30
01-07-2017 20 60 40
01-08-2017 60 20 20
01-09-2017 10 50 10
01-10-2017 60 30 10
01-11-2017 20 20 30
LOAD
"date",
network,
click_event,
success_event,
failure_event,
FROM [lib://Inappmain (qlik-prod_admin1)/event_app.qvd]
(qvd)
Now What I want is a weekly values table like below which
I can load from existing QVD which has daily value
weeklysumtable:
Date Click_event Success_event Failure_event
01-01-2017 30 40 60
01-02-2017 40 50 130
01-03-2017 80 100 160
01-04-2017 140 120 180
01-05-2017 160 140 220
01-06-2017 220 190 250
01-07-2017 240 250 290 (Day 1-7 days added value)
01-08-2017 270 230 250 (Day 2-8 days added value)
01-09-2017 270 270 190 (Day 3-9 days added value)
01-10-2017 290 250 170 (Day 4-10 days added value)
01-11-2017 250 250 180 (Day 5-11 days added value)
Hope this will give clarity on my requirement.
Thanks for your time
- Mark as New
- Bookmark
- Subscribe
- Mute
- Subscribe to RSS Feed
- Permalink
- Report Inappropriate Content
this you can do in the UI, check out the Above function in help
- Mark as New
- Bookmark
- Subscribe
- Mute
- Subscribe to RSS Feed
- Permalink
- Report Inappropriate Content
I have already done with UI but it fails when you select one day in the filter. The UI does not have values to do the sum. Then daily and weekly will have same values. Thanks for your help! Please let me know if I can do something and store weekly values in a QVD that is the way even when you select less than 7 days you still get weekly value.
- « Previous Replies
-
- 1
- 2
- Next Replies »