Unlock a world of possibilities! Login now and discover the exclusive benefits awaiting you.
- Qlik Community
- :
- Forums
- :
- Analytics
- :
- New to Qlik Analytics
- :
- Creating custom groups of locations in Map Chart (...
- Subscribe to RSS Feed
- Mark Topic as New
- Mark Topic as Read
- Float this Topic for Current User
- Bookmark
- Subscribe
- Mute
- Printer Friendly Page
- Mark as New
- Bookmark
- Subscribe
- Mute
- Subscribe to RSS Feed
- Permalink
- Report Inappropriate Content
Creating custom groups of locations in Map Chart (Area Layer)
Hi,
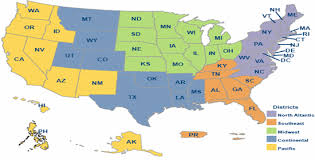
I'm wondering how I can recreate something like the attached image in Qlik Sense? I want to group the various areas in my country into larger regions that don't map directly onto any administrative region that Qlik Sense would recognise and just plot those custom groupings.
I came across this post that seemed to help but it wasn't map based and the custom groupings mapped directly onto continents which wouldnt be the case for me.
Any help would be appreciated.
Thanks
- Mark as New
- Bookmark
- Subscribe
- Mute
- Subscribe to RSS Feed
- Permalink
- Report Inappropriate Content
dont use color by measue
create extra column
if(WildMatch(state,'ND','SD'),'central'..........
use Appearance color
if(Region='central',red(),Green())
- Mark as New
- Bookmark
- Subscribe
- Mute
- Subscribe to RSS Feed
- Permalink
- Report Inappropriate Content
Hey thanks for your reply,
I think maybe I didn't clarify my point in my original post. I'm not worried about colouring the areas on my chart. It's just the custom grouping I want (the colours in the attached image just being a nice way of showing the groups).
So for example I could create a map with just that grouping and in the example of the attached image there would just be 5 regions as opposed to 50 states coloured in 5 colours.
Is this possible do you know?
- Mark as New
- Bookmark
- Subscribe
- Mute
- Subscribe to RSS Feed
- Permalink
- Report Inappropriate Content
so you want to make 50 states as 5 groups ??
if yes it is possible
- Mark as New
- Bookmark
- Subscribe
- Mute
- Subscribe to RSS Feed
- Permalink
- Report Inappropriate Content
Pretty much yea. The country I'm using isn't the US but its the same idea. Basically my map will only show 5 custom regions rather than 50 states. Can you tell me how it's possible as nothing I'm seeing online is helping.
- Mark as New
- Bookmark
- Subscribe
- Mute
- Subscribe to RSS Feed
- Permalink
- Report Inappropriate Content
- Mark as New
- Bookmark
- Subscribe
- Mute
- Subscribe to RSS Feed
- Permalink
- Report Inappropriate Content
Hey,
So I've attached an excel file. The 1st sheet has the counties of Ireland and their population. The 3rd sheet has the mapping of the regions I want to put these counties into so that ultimately I would have a chart that would reflect the data seen in the 2nd sheet. The emphasis here though is on customized regions because for my purpose some counties may have to 'move' into different regions. Just saying that on the off chance you discover that Sense recognizes these regions as administrative regions.
I really appreciate your help. This would be massive for me if it could be figured out. Even if you could show me how one set could be grouped. Sense recognizes these counties so you can just drag straight onto a map.
Much appreciated
- Mark as New
- Bookmark
- Subscribe
- Mute
- Subscribe to RSS Feed
- Permalink
- Report Inappropriate Content
Is this the sort of map you are looking for - Grouping of Counties into Regions? I do this sort of groupings in QGIS and then save to a KML file which I load into Qlik. My totals are a little off as I don't have some of your counties in my mapping file