Unlock a world of possibilities! Login now and discover the exclusive benefits awaiting you.
- Qlik Community
- :
- Forums
- :
- Analytics
- :
- New to Qlik Analytics
- :
- Re: Cummulative Total
- Subscribe to RSS Feed
- Mark Topic as New
- Mark Topic as Read
- Float this Topic for Current User
- Bookmark
- Subscribe
- Mute
- Printer Friendly Page
- Mark as New
- Bookmark
- Subscribe
- Mute
- Subscribe to RSS Feed
- Permalink
- Report Inappropriate Content
Cummulative Total
Hi All,
I am trying to get cumulative total numbers in charts or in table in Qliksence.
I have attached the excel file for example.
Accepted Solutions
- Mark as New
- Bookmark
- Subscribe
- Mute
- Subscribe to RSS Feed
- Permalink
- Report Inappropriate Content
- Mark as New
- Bookmark
- Subscribe
- Mute
- Subscribe to RSS Feed
- Permalink
- Report Inappropriate Content
you can use the below expression for the measure:
rangesum( above( count( id number), 0, rowno(total) ) )
- Mark as New
- Bookmark
- Subscribe
- Mute
- Subscribe to RSS Feed
- Permalink
- Report Inappropriate Content
Something like this
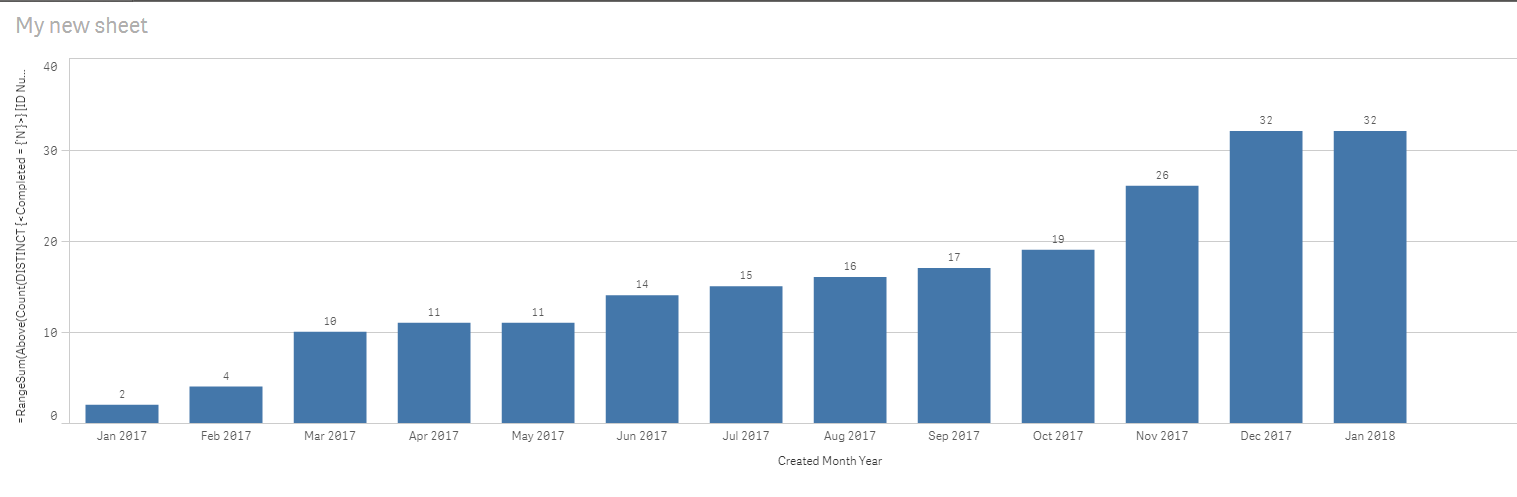
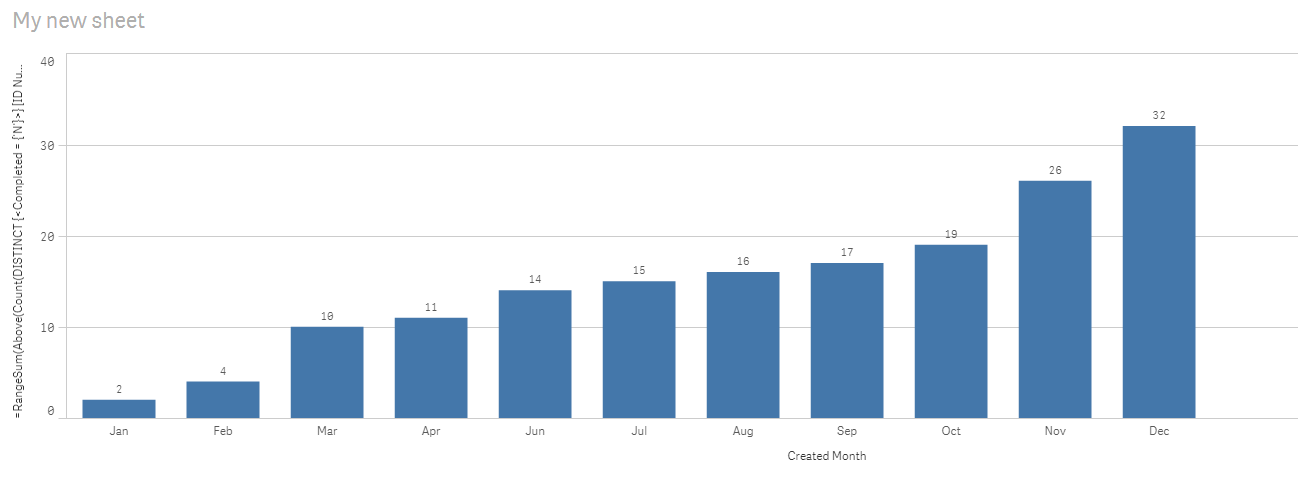
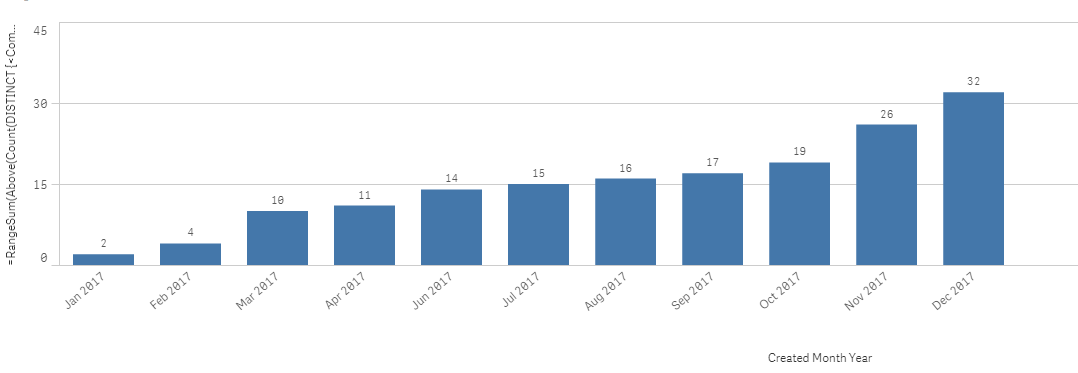
=RangeSum(Above(Count(DISTINCT {<Completed = {'N'}>} [ID Number]), 0, RowNo()))
- Mark as New
- Bookmark
- Subscribe
- Mute
- Subscribe to RSS Feed
- Permalink
- Report Inappropriate Content
Sample image and sample qvf attached
- Mark as New
- Bookmark
- Subscribe
- Mute
- Subscribe to RSS Feed
- Permalink
- Report Inappropriate Content
Hi,
find the attached sample App.

- Mark as New
- Bookmark
- Subscribe
- Mute
- Subscribe to RSS Feed
- Permalink
- Report Inappropriate Content
Thanks Sunny. This work.
I would also like to show current month bar in charts.
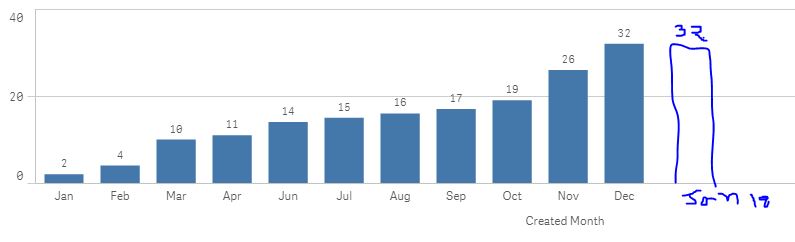
Examples if current month is Jan'18 and although we do not have any entry in jan'18, then I would like show dec'17 number also in Jan'18. Which means we are carry forwarding this number.
- Mark as New
- Bookmark
- Subscribe
- Mute
- Subscribe to RSS Feed
- Permalink
- Report Inappropriate Content
There is no Jan 2018 in the attached application... also, if you would like to do that... then use MonthYear field rather than using Month field
- Mark as New
- Bookmark
- Subscribe
- Mute
- Subscribe to RSS Feed
- Permalink
- Report Inappropriate Content
yes I am using monthyear function. But I want to copy Dec'17 number in Jan'18.
Basically I would like to show 1 extract month copying previous month number.
- Mark as New
- Bookmark
- Subscribe
- Mute
- Subscribe to RSS Feed
- Permalink
- Report Inappropriate Content
I understand, but the Jan-18 have to be in the dashboard to show up right? The value Jan-18 doesn't exists in Month Year field... may be you can create it using a master calendar where you have one extra month... but you need Jan-18 under Month Year to make this possible....
Just to show as an example... I added it like this
Table:
LOAD
"ID Number",
"Created on",
Month([Created on]) as [Created Month],
MonthName([Created on]) as [Created Month Year],
"Required End",
"Actual End Date",
"Completn date",
Completed
FROM [lib://Lib/Need Help.xlsx]
(ooxml, embedded labels, table is DATA);
Concatenate (Table)
LOAD MonthName(MakeDate(2018, 01, 01)) as [Created Month Year]
AutoGenerate 1;
And then this expression
=RangeSum(Above(Count(DISTINCT {<Completed = {'N'}>} [ID Number]) + Sum({1} 0), 0, RowNo()))