Unlock a world of possibilities! Login now and discover the exclusive benefits awaiting you.
- Qlik Community
- :
- Forums
- :
- Analytics
- :
- New to Qlik Analytics
- :
- Cumulative sum in bar chart with 2nd dimension whi...
- Subscribe to RSS Feed
- Mark Topic as New
- Mark Topic as Read
- Float this Topic for Current User
- Bookmark
- Subscribe
- Mute
- Printer Friendly Page
- Mark as New
- Bookmark
- Subscribe
- Mute
- Subscribe to RSS Feed
- Permalink
- Report Inappropriate Content
Cumulative sum in bar chart with 2nd dimension which does not exist in every 1st dimension
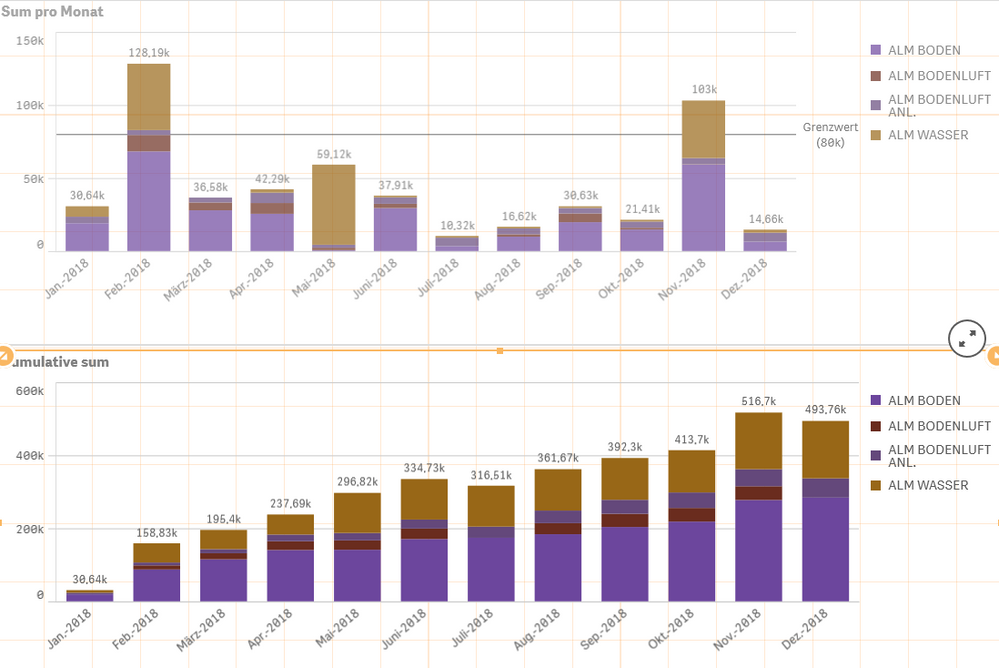
I want to do a cumulative sum of each Probe, grouped in 2 dimensions: accounts and Yearmonth.
but, in some months there're no probes from certain accounts, meaning, this account does not exist if I select specific yearmonth. That's why in cumulative chart, some months are lacking the values of some accounts.
first graph is normal sum of each month:
sum(aggr([PREIS]*(1-[FIRM_RABATT]/100)*num([ANZAHL])*FACTOR, [Probe_Nr]))
the second chart is cumulative sum:
aggr(RangeSum(Above(total
sum(aggr([PREIS]*(1-[FIRM_RABATT]/100)*num([ANZAHL])*FACTOR, [Probe_Nr])),
0, RowNo())) ,ACCOUNT, (YEARMONTH,(numeric, ascending)))
As you can see in the second graph, in July and December, account ALM BODENLUFT is missing. How to make the chart show all 2nd dimensions?
Accepted Solutions
- Mark as New
- Bookmark
- Subscribe
- Mute
- Subscribe to RSS Feed
- Permalink
- Report Inappropriate Content
- Mark as New
- Bookmark
- Subscribe
- Mute
- Subscribe to RSS Feed
- Permalink
- Report Inappropriate Content
Not sure if this will work or not based on your data... but try this
Aggr(
  RangeSum(Above(TOTAL
    Sum(Aggr([PREIS]*(1-[FIRM_RABATT]/100)*num([ANZAHL])*FACTOR, [Probe_Nr]))
    +
    Sum({1} 0)
  , 0, RowNo()))
, ACCOUNT, (YEARMONTH, (numeric, ascending)))- Mark as New
- Bookmark
- Subscribe
- Mute
- Subscribe to RSS Feed
- Permalink
- Report Inappropriate Content
Hi Luohda,
May be go through the below thread
https://community.qlik.com/t5/New-to-Qlik-Sense/cumulative-sum-in-bar-chart/td-p/33644/page/2
In your expression please add both the dimension
aggr(RangeSum(Above(total
sum(aggr([PREIS]*(1-[FIRM_RABATT]/100)*num([ANZAHL])*FACTOR, [Probe_Nr])),
0, RowNo())) ,ACCOUNT, (YEARMONTH,(numeric, ascending)))
I believe Account is your 1st dimension and 2nd dimension is missing i believe please check and add accordingly it missing.
Another reason could be the data is missing for those 2 months in data source please verify.
Regards,
Puneet Agarwal
- Mark as New
- Bookmark
- Subscribe
- Mute
- Subscribe to RSS Feed
- Permalink
- Report Inappropriate Content
(YEARMONTH,(numeric, ascending)) is the first dimension, ACCOUNT is the second. So far everything works, just the missing value for that missing acount in 2 months.
yes the account dimension is missing in those 2 months, how can I make it pop out? even when it does not exist in these 2 months?
- Mark as New
- Bookmark
- Subscribe
- Mute
- Subscribe to RSS Feed
- Permalink
- Report Inappropriate Content
- Mark as New
- Bookmark
- Subscribe
- Mute
- Subscribe to RSS Feed
- Permalink
- Report Inappropriate Content
Yes, you are right...
