Unlock a world of possibilities! Login now and discover the exclusive benefits awaiting you.
- Qlik Community
- :
- Forums
- :
- Analytics
- :
- New to Qlik Analytics
- :
- Re: Current limitations and QlikSense roadmap
- Subscribe to RSS Feed
- Mark Topic as New
- Mark Topic as Read
- Float this Topic for Current User
- Bookmark
- Subscribe
- Mute
- Printer Friendly Page
- Mark as New
- Bookmark
- Subscribe
- Mute
- Subscribe to RSS Feed
- Permalink
- Report Inappropriate Content
Current limitations and QlikSense roadmap
Gents,
I am into QlikSense for the last 2 months and along with great opportunities it gives me, it still has certain limitations which strongly limit the use of the software.
Below is the list of the most critical for me.
Do you have any plans to change it in the coming updates?
Thank you, your answers are much appreciated!
1. Plans to support reference to calculated measures in calculated measures? Let's say i created custom measure Measure1 =SUM(A) and then want to create measure Measure2 = [Measure1] / 2. It is not possible at the moment (workaround with variables is still a workaround).
2. Will it be possible to reference calculated Measures and calculated Dimensions in formulas, in chart options, in tables and PIVOT's, etc.? Let's say I want to create column in table with a formula Measure1 + Measure2 (from the above example, these measure are 'calculated'). Or i want to change the color of the Bar in the chart with a simple formula like if(Measure (not the name, but the substance) = [Measure], green(), blue() )).
3. in the PIVOT, with measure as ROWS, will it be possible to add Calculated columns Like, creating the difference column DifferenceColumn = ( column(1) - column(2) ), where Column 1 and Column 2 are the products of the PIVOT and DifferenceColumn is the calculated column (imagine classic Profit and Loss statement comparison between two periods)?
4. Plans for Combo chart to have 2 measures and show data points?
5. Customizable graphs - fine tuning of the the Bar / Line / other charts? Like easily changing column's width, height, columns indent, colors, zoom and etc. (not through extensive formulas, but through mouse point and change)? Currently majority of charts look ugly and occupy a lot of space.
- Mark as New
- Bookmark
- Subscribe
- Mute
- Subscribe to RSS Feed
- Permalink
- Report Inappropriate Content
Hi Gleb,
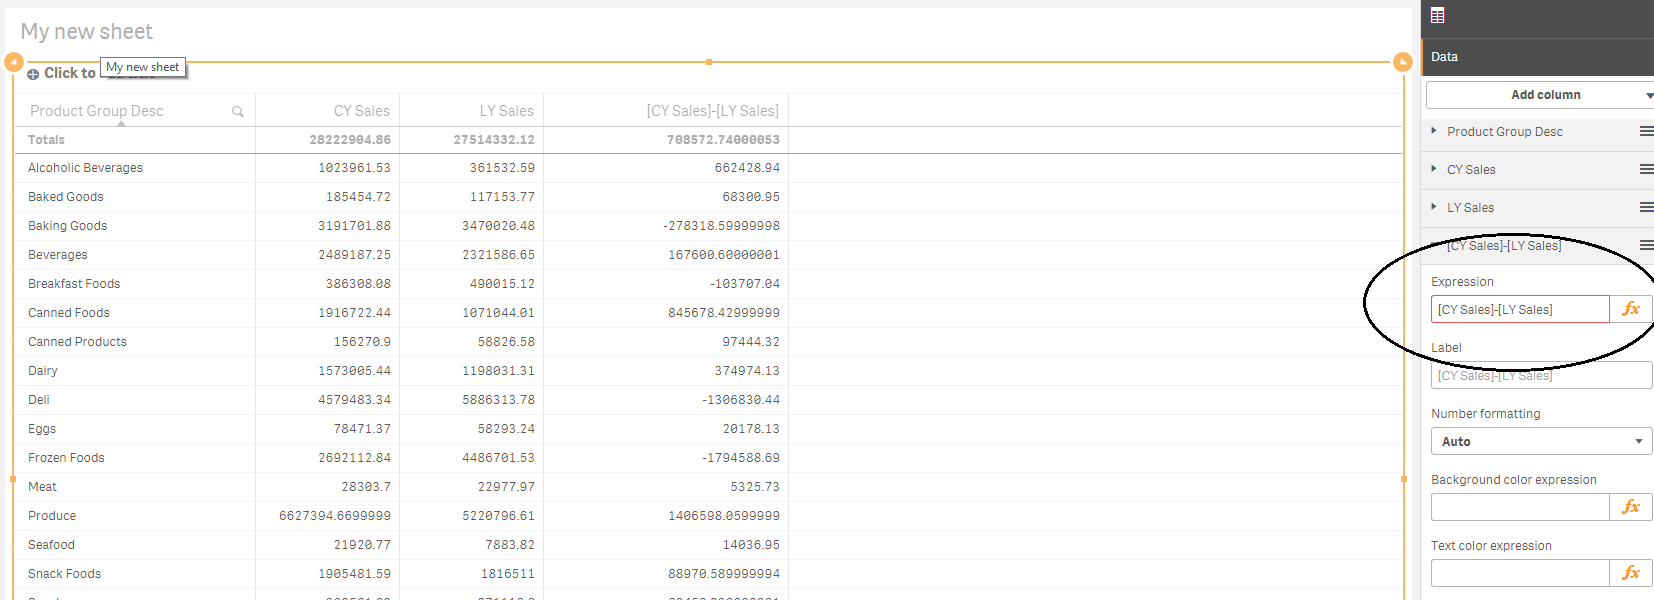
For third one, you can achieve this on the sense.
For example you have two column on table as 'Profit' and 'Loss'. You can add measure on table and write [Profit]-[Loss] (it will show error but don't mind), qlik sense calculates the column as you want

- Mark as New
- Bookmark
- Subscribe
- Mute
- Subscribe to RSS Feed
- Permalink
- Report Inappropriate Content
Kaan, it's not that simple.
There is one measure involved in your example (Sales).
I have 20+ measures - these are my KPI's. (sales, margin, markups, discounts).
Therefore I need a column SUM (Measure), rather than 20+ different columns. It is not doable in QS.
- Mark as New
- Bookmark
- Subscribe
- Mute
- Subscribe to RSS Feed
- Permalink
- Report Inappropriate Content
Hi Gleb,
In my opinion, never a typical Qlik Sense functionality, like any other software product, will be enough to satisfy the requirements of absolutely all users - too many different tasks. Developers in any case will develop Qlik Sense, based on their own views.
Almost any missing functionality can be compensated by creating extensions Qlik Sense. To do this, Qlik Sense has all the necessary tools. But for the development of extensions, unfortunately, an entirely separate layer of knowledge is additionally needed.
Regards,
Andrey
- Mark as New
- Bookmark
- Subscribe
- Mute
- Subscribe to RSS Feed
- Permalink
- Report Inappropriate Content