Unlock a world of possibilities! Login now and discover the exclusive benefits awaiting you.
- Qlik Community
- :
- Forums
- :
- Analytics
- :
- New to Qlik Analytics
- :
- Re: Custom Y - Axis Scaling
- Subscribe to RSS Feed
- Mark Topic as New
- Mark Topic as Read
- Float this Topic for Current User
- Bookmark
- Subscribe
- Mute
- Printer Friendly Page
- Mark as New
- Bookmark
- Subscribe
- Mute
- Subscribe to RSS Feed
- Permalink
- Report Inappropriate Content
Custom Y - Axis Scaling
Hi,
I have a requirement for custom scaling on Y axis in Qlik sense. i see Min and Max scaling option in Qliksense but did not help that. can we write any expression or any setting can be made to achieve the below
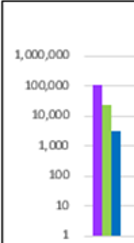
currently my y axis look like below

I need the scale on y axis to look as below
Thanks - sravan
- Mark as New
- Bookmark
- Subscribe
- Mute
- Subscribe to RSS Feed
- Permalink
- Report Inappropriate Content
Hi Sravan,
Yes, it's there.
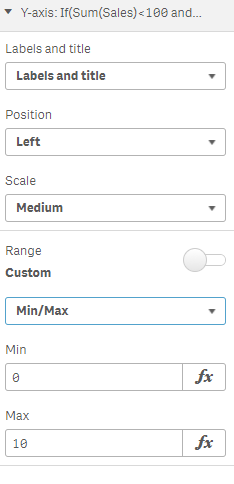
Appearance -> Y Axis
Change the Range to Custom and then select Min, Max or Min/Max
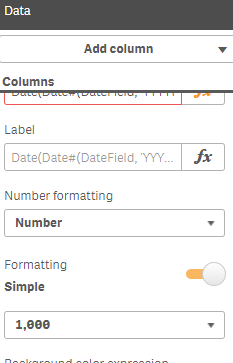
And you can change the format of the expression data in the Data part.
Hope that helps.
Thanks,
Simon
- Mark as New
- Bookmark
- Subscribe
- Mute
- Subscribe to RSS Feed
- Permalink
- Report Inappropriate Content
Thanks for the reply Simon. i tried Min/Max it just sets min value and max value , here i also want to set the scale between them
If i set min to 10 and max to 200k it gives y axis as 10, 200k, 500k, 150k like something
i want to set as 10 100 1000 10000 etc
Thanks- sravan
- Mark as New
- Bookmark
- Subscribe
- Mute
- Subscribe to RSS Feed
- Permalink
- Report Inappropriate Content
Hi Sravan,
You'll need to change that formatting in the Data -> measure -> Number Formatting part of the interface.
Best regards,
Simon
- Mark as New
- Bookmark
- Subscribe
- Mute
- Subscribe to RSS Feed
- Permalink
- Report Inappropriate Content
Did not work Simon , Thanks
BTW i wan the scale to be fixed like 1, 10, 100, 1000, 10000 .
thanks- sravan
- Mark as New
- Bookmark
- Subscribe
- Mute
- Subscribe to RSS Feed
- Permalink
- Report Inappropriate Content
Hi,
In QlikView Log scale is an option (Logarithmic bar chart shows null dimensional value with larger count than other values is showing up...). In QlikSense it is not available but you may try to change your expression using Log function and see if that will help
log10(x )
- Mark as New
- Bookmark
- Subscribe
- Mute
- Subscribe to RSS Feed
- Permalink
- Report Inappropriate Content
did you find anything on this ?
or any new feature available in current Qlik sense 2019 version