Unlock a world of possibilities! Login now and discover the exclusive benefits awaiting you.
- Qlik Community
- :
- Forums
- :
- Analytics
- :
- New to Qlik Analytics
- :
- Re: Data Disappears when [Delivery Year] Selected
- Subscribe to RSS Feed
- Mark Topic as New
- Mark Topic as Read
- Float this Topic for Current User
- Bookmark
- Subscribe
- Mute
- Printer Friendly Page
- Mark as New
- Bookmark
- Subscribe
- Mute
- Subscribe to RSS Feed
- Permalink
- Report Inappropriate Content
Data Disappears when [Delivery Year] Selected
Hello Everyone,
I'm having a problem similar to the one I had yesterday, whereby when I select a [Delivery Year] all the Expressions using
Sum({<[Delivery Year] = {$(=max([Delivery Year])-1)}>} [Total Travel Miles])
disappear from my chart. I'm not sure if this has anything to do with my field [Delivery Year] being a "Master Dimension" or not.
When I open my chart, and I don't select anything other than the Bill To Id, I have the sum of miles for 3 years. Max([Delivery Year]), Max([Delivery Year]) - 1, Max([Delivery Year]) - 2.
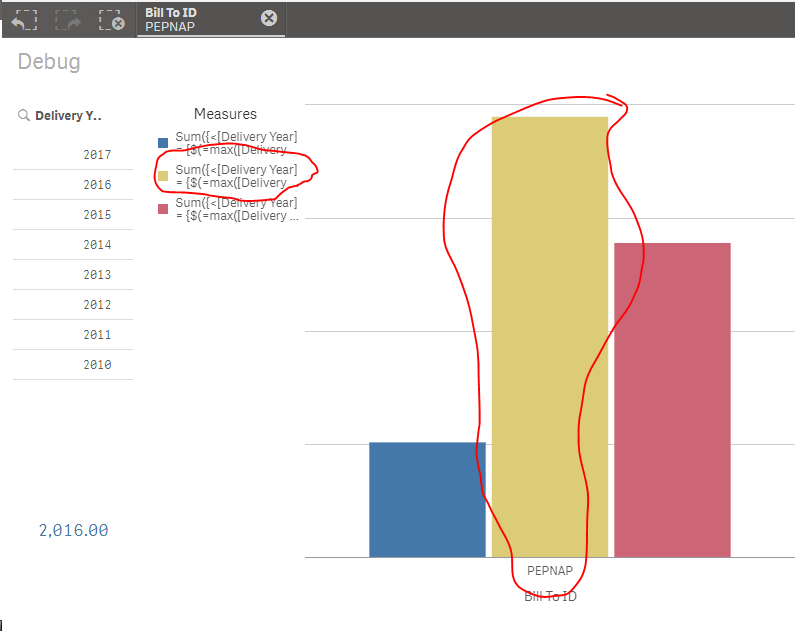
This is the correct data. HOWEVER, when I select a [Delivery Year] = '2017', I lose the last two years and only keep the Max(Year).
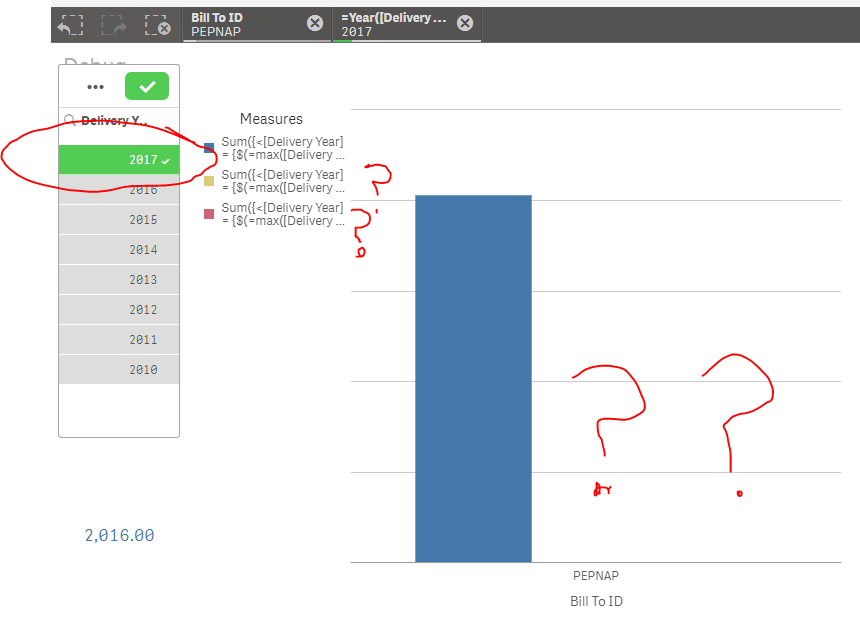
Why does my data disappear? I was under the understanding that the Bar Chart wouldn't care about what [Delivery Year] was set to, but would only care about the results of the Set Analysis.
Any help is greatly appreciated.
- Mark as New
- Bookmark
- Subscribe
- Mute
- Subscribe to RSS Feed
- Permalink
- Report Inappropriate Content
In your measures, you're working with "Delivery Year" field; while you're filtering with a field : year("Delivery Year")
Use as a filter : "Delivery Year" not year("Delivery Year")
- Mark as New
- Bookmark
- Subscribe
- Mute
- Subscribe to RSS Feed
- Permalink
- Report Inappropriate Content
Solution: In the data model, there is a field named [Delivery Year] which comes from the database. In the App, there is a Master Dimension ALSO named "Delivery Date". It is calculated like this.
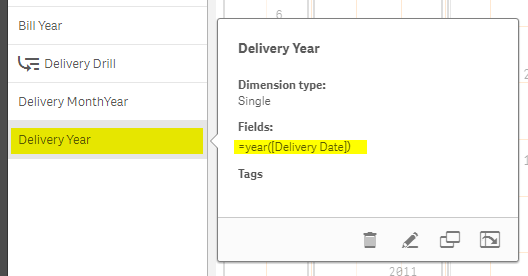
So while my the first chart was using one Delivery Date, my chart with the problem was using another causing the issue. Not sure how I'm going to solve this.
- Mark as New
- Bookmark
- Subscribe
- Mute
- Subscribe to RSS Feed
- Permalink
- Report Inappropriate Content
As I said; you have to even have as a filter "Delivery Date" not the master dimension; or create this Master Dimension as a field in your script; and use it as both a filter and in your expressions