Unlock a world of possibilities! Login now and discover the exclusive benefits awaiting you.
- Qlik Community
- :
- Forums
- :
- Analytics
- :
- New to Qlik Analytics
- :
- Different dimension's colours in charts
- Subscribe to RSS Feed
- Mark Topic as New
- Mark Topic as Read
- Float this Topic for Current User
- Bookmark
- Subscribe
- Mute
- Printer Friendly Page
- Mark as New
- Bookmark
- Subscribe
- Mute
- Subscribe to RSS Feed
- Permalink
- Report Inappropriate Content
Different dimension's colours in charts
Hi,
I'm trying to give the same colour to the dimension that i want to rappresent in a chart.
This is the problem:

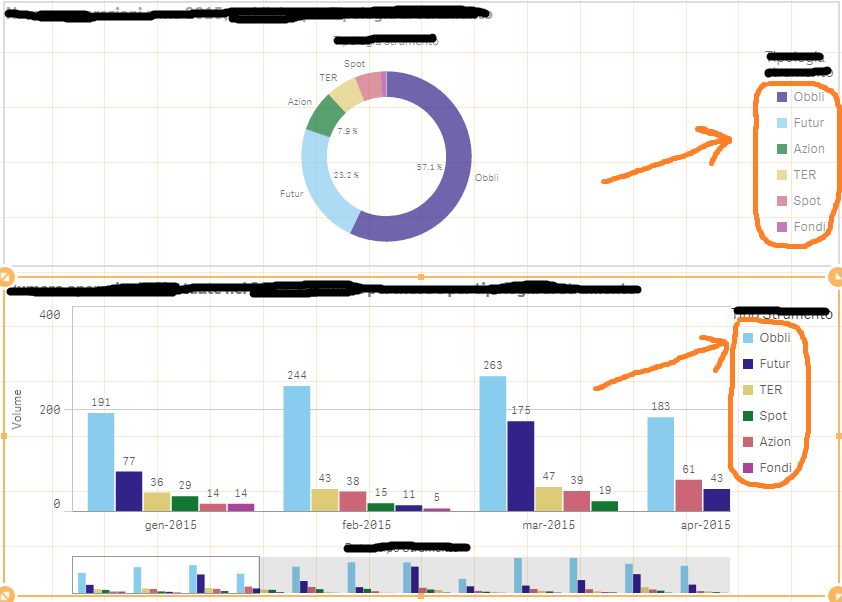
How you can see, I have this two charts with the same dimensions, but with different colours.
For example, for the value "Obbli" and "Futur" I have different colours that is a problem in terms of data visualization.
How can I give the same colours to the dimension value?
I tried to have a look in the chart properties, and I think I have to write an expression in the section "Custom Colours". I was looking for examples but I didn't find examples.
Thank you.
Accepted Solutions
- Mark as New
- Bookmark
- Subscribe
- Mute
- Subscribe to RSS Feed
- Permalink
- Report Inappropriate Content
Yes you can do it.
Go to Chart properties>Colors and Legends>Custom Colors>By dimension or measure (whichever suits you)>Persistent Colors
By selecting persistent colors the color will remain same upon selection. Find the attached image.
If that doesn't work, give the color expressions in both charts and it will be similar (only if you using same measure in both charts)
Thanks.
- Mark as New
- Bookmark
- Subscribe
- Mute
- Subscribe to RSS Feed
- Permalink
- Report Inappropriate Content
Added thought;
If working with a sense version without the persist functionality, try hard-coding the colors in an expression(Appearance>Custom Colors>By Expression) using a nested IF statement.
Example assuming dimension is Product_ID:
if(Product_ID='Spot', LightBlue(),if(Product_ID = 'Obbli', LightGreen(),Yellow()))
Alternatively if working with a number of dimensions the nested IF option could be cumbersome, in this case try mapping the colors within the script as detailed here Colors in charts
- Mark as New
- Bookmark
- Subscribe
- Mute
- Subscribe to RSS Feed
- Permalink
- Report Inappropriate Content
Hi,
I am in similar situation as above. However, I do not have custom color option in QlikView. I use different dimensions and need to display persistent color across dashboard. Is there any alternative to achieve this?
Thanks in advace!
Sai