Unlock a world of possibilities! Login now and discover the exclusive benefits awaiting you.
- Qlik Community
- :
- Forums
- :
- Analytics
- :
- New to Qlik Analytics
- :
- Re: Dimension into measure
- Subscribe to RSS Feed
- Mark Topic as New
- Mark Topic as Read
- Float this Topic for Current User
- Bookmark
- Subscribe
- Mute
- Printer Friendly Page
- Mark as New
- Bookmark
- Subscribe
- Mute
- Subscribe to RSS Feed
- Permalink
- Report Inappropriate Content
Dimension into measure
Dear people,
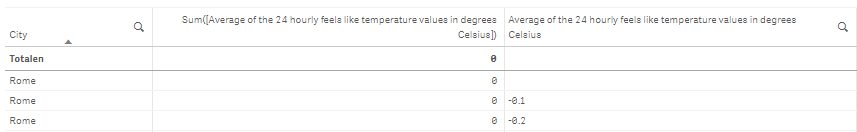
I have a problem with the weather data from Qlik. If I want to use the temperature as a measurement, then I get 0 values while they are displayed properly if I use them as a dimension. Someone any idea how this can and what I have to change to use the weather as a measurement?
Gr, Willem
- « Previous Replies
-
- 1
- 2
- Next Replies »
- Mark as New
- Bookmark
- Subscribe
- Mute
- Subscribe to RSS Feed
- Permalink
- Report Inappropriate Content
Might just be the formatting of your measure:
(Sorry for the Dutch terms)
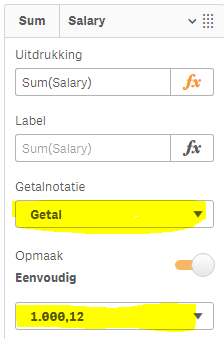
If you change the "Getalnotatie" from 'Automatic' to 'Number', you should be able to see the values correctly.
- Mark as New
- Bookmark
- Subscribe
- Mute
- Subscribe to RSS Feed
- Permalink
- Report Inappropriate Content
why do you need to use temp as measure ?
- Mark as New
- Bookmark
- Subscribe
- Mute
- Subscribe to RSS Feed
- Permalink
- Report Inappropriate Content
okay this is unfortunately not the solution, He continues to give 0 values.
- Mark as New
- Bookmark
- Subscribe
- Mute
- Subscribe to RSS Feed
- Permalink
- Report Inappropriate Content
to aggregate it and to use it in graphs
- Mark as New
- Bookmark
- Subscribe
- Mute
- Subscribe to RSS Feed
- Permalink
- Report Inappropriate Content
Any chance you could give us a sample qvf? Always easier to check things than guessing what could be wrong.
- Mark as New
- Bookmark
- Subscribe
- Mute
- Subscribe to RSS Feed
- Permalink
- Report Inappropriate Content
Sorry i dont know how to share an app from Qlik sense enterprise but here you have the script.
Data:
LOAD
qlik_datamarket_52kv._dim_8vq5,
"Date",
"Average of the 24 hourly cloud cover observations as a percentage",
"Average of the 24 hourly dew point observations in degrees Celsius",
"Average of the 24 hourly dew point observations in degrees Fahrenheit",
"Average of the 24 hourly feels like temperature values in degrees Celsius",
"Average of the 24 hourly feels like temperature values in degrees Fahrenheit",
"Average of the 24 hourly relative humidity values as a percentage",
"Average of the 24 hourly station pressure observations in millibars",
"Average of the 24 hourly temperature observations in degrees Celsius",
"Average of the 24 hourly temperature observations in degrees Fahrenheit",
"Average of the 24 hourly wetbulb values in degrees Celsius",
"Average of the 24 hourly wetbulb values in degrees Fahrenheit",
"Average of the 24 hourly wind speed observations in km per hour",
"Average of the 24 hourly wind speed observations in miles per hour",
"Average of the daily minimum and maximum temperatures in Celsius",
"Average of the daily minimum and maximum temperatures in Fahrenheit",
"Cooling degree day value from daily average temperature in Fahrenheit",
"Cooling degree day value from daily average temperature in degrees Celsius",
"Daily total precipitation (rainfall and/or melted amount of snow) in cm",
"Daily total precipitation (rainfall and/or melted amount of snow) in inches",
"Daily total snowfall in cm",
"Daily total snowfall in inches",
"Heating degree day value from daily average temperature in Fahrenheit",
"Heating degree day value from daily average temperature in degrees Celsius",
"Maximum daily temperature in degrees Celsius",
"Maximum daily temperature in degrees Fahrenheit",
"Maximum of the 24 hourly cloud cover observations as a percentage",
"Maximum of the 24 hourly dew point observations in degrees Celsius",
"Maximum of the 24 hourly dew point observations in degrees Fahrenheit",
"Maximum of the 24 hourly feels like temperature values in degrees Celsius",
"Maximum of the 24 hourly feels like temperature values in degrees Fahrenheit",
"Maximum of the 24 hourly relative humidity values as a percentage",
"Maximum of the 24 hourly station pressure observations in millibars",
"Maximum of the 24 hourly wetbulb values in degrees Celsius",
"Maximum of the 24 hourly wetbulb values in degrees Fahrenheit",
"Maximum of the 24 hourly wind speed observations in km per hour",
"Maximum of the 24 hourly wind speed observations in miles per hour",
"Minimum daily temperature in degrees Celsius",
"Minimum daily temperature in degrees Fahrenheit",
"Minimum of the 24 hourly cloud cover observations as a percentage",
"Minimum of the 24 hourly dew point observations in degrees Celsius",
"Minimum of the 24 hourly dew point observations in degrees Fahrenheit",
"Minimum of the 24 hourly feels like temperature values in degrees Celsius",
"Minimum of the 24 hourly feels like temperature values in degrees Fahrenheit",
"Minimum of the 24 hourly relative humidity values as a percentage",
"Minimum of the 24 hourly station pressure observations in millibars",
"Minimum of the 24 hourly wetbulb values in degrees Celsius",
"Minimum of the 24 hourly wetbulb values in degrees Fahrenheit",
"Minimum of the 24 hourly wind speed observations in km per hour",
"Minimum of the 24 hourly wind speed observations in miles per hour"
FROM [lib://QlikView_Content_vdPlas (heembloemex_qliksensebeheer)/Production\Data\QVD\Source_Weather\Weather_Data_50_Cities.qvd]
(qvd);
Locations:
LOAD
qlik_datamarket_52kv._dim_8vq5,
Country,
City,
"ICAO airport code",
"ISO 3166",
Latitude,
Longitude,
"Numeric time zone",
"Olson time zone",
"WMO station identifier"
FROM [lib://QlikView_Content_vdPlas (heembloemex_qliksensebeheer)/Production\Data\QVD\Source_Weather\Location.qvd]
(qvd);
- Mark as New
- Bookmark
- Subscribe
- Mute
- Subscribe to RSS Feed
- Permalink
- Report Inappropriate Content
Script won't help much as it's loading data from a connection I don't have 
Should be able to export applications from Qlik Sense Enterprise.
Trying to get the data from Data Market right now, will let you now if I can reproduce the issue.
- Mark as New
- Bookmark
- Subscribe
- Mute
- Subscribe to RSS Feed
- Permalink
- Report Inappropriate Content
could you attach a printscreen adding temp as dimension ?
are you sure temp field type is number ?
- Mark as New
- Bookmark
- Subscribe
- Mute
- Subscribe to RSS Feed
- Permalink
- Report Inappropriate Content
I just checked and as far as I can tell, the temp field is not a number.
But conversion using Num#() returns the value without converting the type.
Conversion using Num() returns Null-values.
- « Previous Replies
-
- 1
- 2
- Next Replies »