Unlock a world of possibilities! Login now and discover the exclusive benefits awaiting you.
- Qlik Community
- :
- Forums
- :
- Analytics
- :
- New to Qlik Analytics
- :
- Re: Doubt in Straight table in Qlik sense
- Subscribe to RSS Feed
- Mark Topic as New
- Mark Topic as Read
- Float this Topic for Current User
- Bookmark
- Subscribe
- Mute
- Printer Friendly Page
- Mark as New
- Bookmark
- Subscribe
- Mute
- Subscribe to RSS Feed
- Permalink
- Report Inappropriate Content
Doubt in Straight table in Qlik sense
Hi,
I want to make a straight table for showing the region wise profit percentage of sample superstore dataset in Qlik Sense but i am unable to do that so can you please suggest me what code should i write to calculate the profit percentage.
- Tags:
- mike tarallo
- « Previous Replies
- Next Replies »
- Mark as New
- Bookmark
- Subscribe
- Mute
- Subscribe to RSS Feed
- Permalink
- Report Inappropriate Content
Hi,
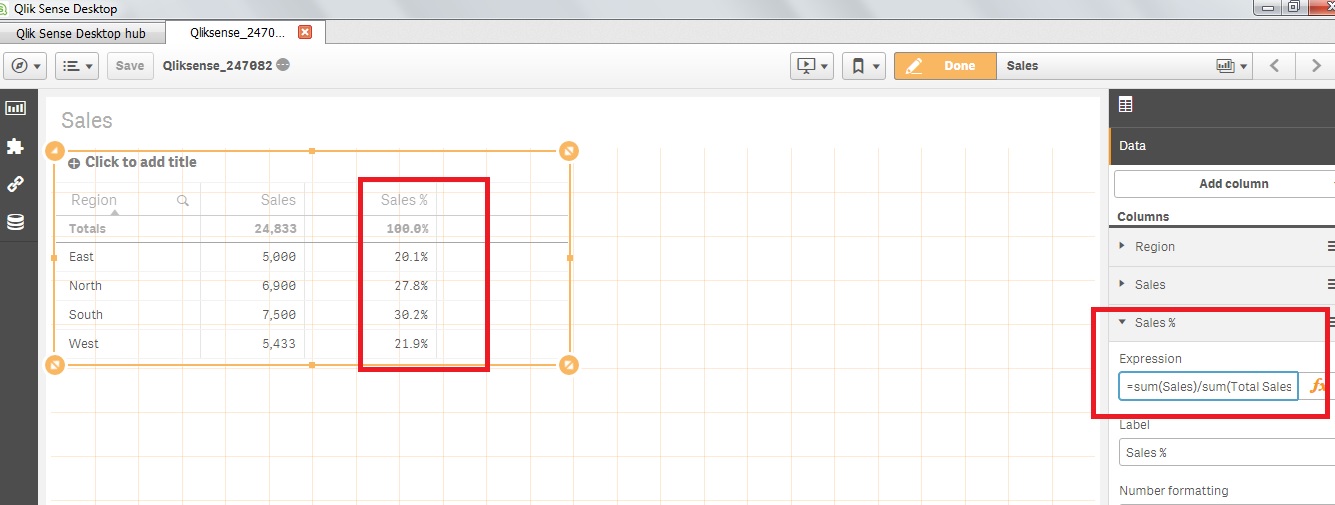
Use below calculated column,
% of Sales Total:
=sum(Sales)/sum(Total Sales)
- Mark as New
- Bookmark
- Subscribe
- Mute
- Subscribe to RSS Feed
- Permalink
- Report Inappropriate Content
You need to be a bit more specific an let us know what exactly you are dealing with
QlikCommunity Tip: How to get answers to your post?
If a post helps to resolve your issue, please accept it as a Solution.
- Mark as New
- Bookmark
- Subscribe
- Mute
- Subscribe to RSS Feed
- Permalink
- Report Inappropriate Content
Hi Vineeth,
Actually I want to calculate Region Wise Profit percentage in Sample superstore dataset.
- Mark as New
- Bookmark
- Subscribe
- Mute
- Subscribe to RSS Feed
- Permalink
- Report Inappropriate Content
Hi Vineeth,
Actually I want to calculate Region Wise Profit percentage in Sample superstore dataset.
- Mark as New
- Bookmark
- Subscribe
- Mute
- Subscribe to RSS Feed
- Permalink
- Report Inappropriate Content
Sorry but i don't see what you are working with, can you a small sample in excel and also what the expected output should look like
If a post helps to resolve your issue, please accept it as a Solution.
- Mark as New
- Bookmark
- Subscribe
- Mute
- Subscribe to RSS Feed
- Permalink
- Report Inappropriate Content
I have 4 regions in my dataset and profit percentage in that region. So i want to calculate the profit percentage respective to the regions in straight table. Like in Pie chart % has automatically calculated.
- Mark as New
- Bookmark
- Subscribe
- Mute
- Subscribe to RSS Feed
- Permalink
- Report Inappropriate Content
Hi,
Have tried my attached solution? it should work for your case.
you just need to create new calculated column,
=sum(Sales)/sum(Total Sales)

Tks, Deva
- Mark as New
- Bookmark
- Subscribe
- Mute
- Subscribe to RSS Feed
- Permalink
- Report Inappropriate Content
Thank You Devarasu but how can we put % sign at the end and also can we round the % to only a single digit after the decimal.
- Mark as New
- Bookmark
- Subscribe
- Mute
- Subscribe to RSS Feed
- Permalink
- Report Inappropriate Content
Hi,
It's there under table property (just look at measure column properties. Hope this helps.
- « Previous Replies
- Next Replies »