Unlock a world of possibilities! Login now and discover the exclusive benefits awaiting you.
- Qlik Community
- :
- Forums
- :
- Analytics
- :
- New to Qlik Analytics
- :
- Drill down and grouping dimensions
- Subscribe to RSS Feed
- Mark Topic as New
- Mark Topic as Read
- Float this Topic for Current User
- Bookmark
- Subscribe
- Mute
- Printer Friendly Page
- Mark as New
- Bookmark
- Subscribe
- Mute
- Subscribe to RSS Feed
- Permalink
- Report Inappropriate Content
Drill down and grouping dimensions
Good afternoon,
I'm relatively new to Qlik and by watching the demos and mto's videos I've been able to create some dashboards. I'm playing with the drill down and grouping dimensions and was wondering if they can be used combined in the same chart?
Using the cars data set of the grouping video, I'd like to create a bar chart starting with a grouped dimension called manufacturer (using the wildmatch command), and drill down to the specific name of the car. I was able to create both grouping and drill down dimensions but when creating the chart, I can not find the grouping dimension on the options displayed, only the original dimensions of the data set.
I'd appreciate if someone can help me with this.
Regards.
Luis
- « Previous Replies
-
- 1
- 2
- Next Replies »
- Mark as New
- Bookmark
- Subscribe
- Mute
- Subscribe to RSS Feed
- Permalink
- Report Inappropriate Content
Hi,
Just do following:
Create Drill down by adding:
- first dimension - Country
- Second dimension (here click on fx icon (in line where you put name, right next to X icon) and enter there your long "if (Wildmatch ...)" expression. Thath expression will replace Name field
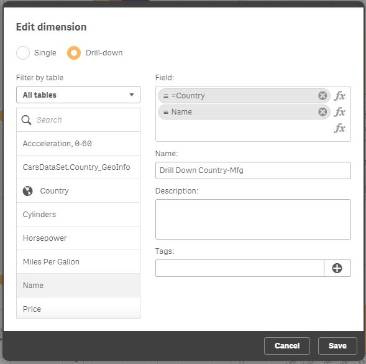
see if this works
cheers
- Mark as New
- Bookmark
- Subscribe
- Mute
- Subscribe to RSS Feed
- Permalink
- Report Inappropriate Content
Just made it and works perfectly!
A formatting question: since the expression is written next to the F(X), it is displayed at the bottom of the chart. I guess there is no way to show a label instead of the whole expression, right?
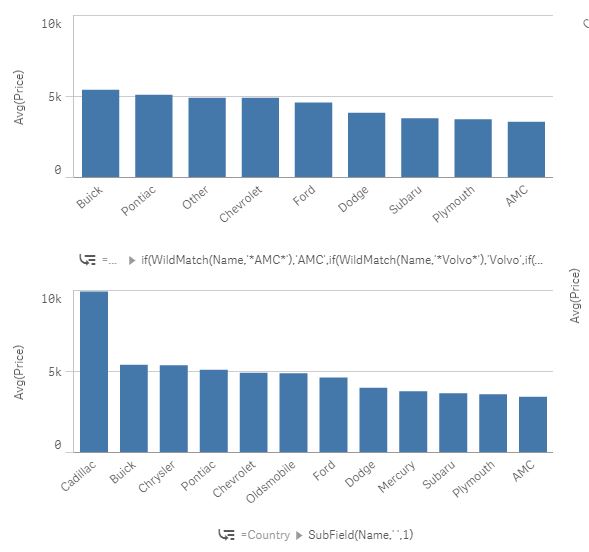
As you can see I also made the chart with the subfield command which works too, just that this really depends on the formatting of the data. In this case all the fields have the manufacturer first and then the model; if any field wasn't like this, then it wouldn't have worked with subfield.
In the case of the wildmatch command, I didn't have that many different manufacturers, therefore it was easy to write the expression; otherwise it would've been complicated.
Thanks for all your help bro!
Pura vida from Costa Rica!
- Mark as New
- Bookmark
- Subscribe
- Mute
- Subscribe to RSS Feed
- Permalink
- Report Inappropriate Content
Hi,
Label in this case is difficult to do. The only way is to use your Wildmatch fucntion on script to create proper/separate field in your data model for manufacturer dimension. This should also be your good practice. You do not really want calculated dimensions as they make Labeling harder and also apear ugly in current selection bar.
regards
Lech
- « Previous Replies
-
- 1
- 2
- Next Replies »