Unlock a world of possibilities! Login now and discover the exclusive benefits awaiting you.
- Qlik Community
- :
- Forums
- :
- Analytics
- :
- New to Qlik Analytics
- :
- Duplicate Date on X-Axis Line Graph
- Subscribe to RSS Feed
- Mark Topic as New
- Mark Topic as Read
- Float this Topic for Current User
- Bookmark
- Subscribe
- Mute
- Printer Friendly Page
- Mark as New
- Bookmark
- Subscribe
- Mute
- Subscribe to RSS Feed
- Permalink
- Report Inappropriate Content
Duplicate Date on X-Axis Line Graph
I have a line graph with a dimension "cboDate", tied into a measure of "Index Number".... What I am trying to do is get the line graph to show the count of how many individual Index Numbers for each single date.
When just adding "cboDate" as Dim and "Index Number" as measure I get a X-Axis that lists duplicate same dates but I want it to add all the Index numbers that took place on each day only. Any ideas? Thanks in advance.
Accepted Solutions
- Mark as New
- Bookmark
- Subscribe
- Mute
- Subscribe to RSS Feed
- Permalink
- Report Inappropriate Content
A date is a so called dual field with a text representation and a number presentation. Your text presentation may be set to show a single day, but the number representation probably includes the time and this is why QV is treating this as different values.
You could use a calculated dimension like
=Date(Floor(cboDate),'DD-MM-YYYY')
performance wise it is better to create this field in the load script
- Mark as New
- Bookmark
- Subscribe
- Mute
- Subscribe to RSS Feed
- Permalink
- Report Inappropriate Content
Try this
- Try to convert cboDate in the script to proper date format with distinct .
- If your creating any master calendar from the cboDate , try to take distinct and create a calendar.
If possible please share a sample app ...
- Mark as New
- Bookmark
- Subscribe
- Mute
- Subscribe to RSS Feed
- Permalink
- Report Inappropriate Content
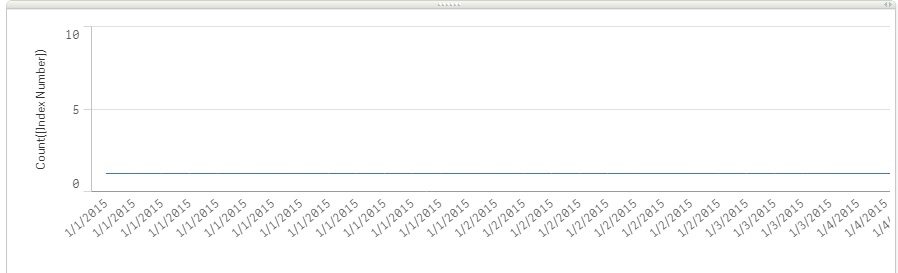
As you can see my Y-Axis is a count of "Index Numbers" that are logged throughout the day... However, each index number is attached to a date. I do not want the same date repeated on the X-Axis.
- Mark as New
- Bookmark
- Subscribe
- Mute
- Subscribe to RSS Feed
- Permalink
- Report Inappropriate Content
can you share a sample data to look into it..
- Mark as New
- Bookmark
- Subscribe
- Mute
- Subscribe to RSS Feed
- Permalink
- Report Inappropriate Content
I am not authorized to.
- Mark as New
- Bookmark
- Subscribe
- Mute
- Subscribe to RSS Feed
- Permalink
- Report Inappropriate Content
A date is a so called dual field with a text representation and a number presentation. Your text presentation may be set to show a single day, but the number representation probably includes the time and this is why QV is treating this as different values.
You could use a calculated dimension like
=Date(Floor(cboDate),'DD-MM-YYYY')
performance wise it is better to create this field in the load script
- Mark as New
- Bookmark
- Subscribe
- Mute
- Subscribe to RSS Feed
- Permalink
- Report Inappropriate Content
Perfect. Thank-You!