Unlock a world of possibilities! Login now and discover the exclusive benefits awaiting you.
- Qlik Community
- :
- Forums
- :
- Analytics
- :
- New to Qlik Analytics
- :
- Re: Dynamic Date Range in set analysis
- Subscribe to RSS Feed
- Mark Topic as New
- Mark Topic as Read
- Float this Topic for Current User
- Bookmark
- Subscribe
- Mute
- Printer Friendly Page
- Mark as New
- Bookmark
- Subscribe
- Mute
- Subscribe to RSS Feed
- Permalink
- Report Inappropriate Content
Dynamic Date Range in set analysis
Hi all,
I would like to calculate the devices deployed per Quarter so I have created a pivot table.
The problem comes when I select more than one quarter.
The InstallationDate Date range is wrong due to min/max dates which are 6 months (if I select 2 quarters), 9 or 12 depending on the number of quarters selected.
Set anlysis:
sum({< InstallationDate={"$(= '>=' & Date(MakeDate(Year(QuarterStart(min(MonthYear),0,11)), Month(QuarterStart(min(MonthYear),0,11))),'DD/MM/YYYY 00:00:00') &
'<' & Date(MakeDate(Year(QuarterStart(Addmonths(max(MonthYear),1),0,11)), Month(QuarterStart(addmonths(max(MonthYear),1),0,11))),'DD/MM/YYYY 00:00:00')
)"}, Month_Date={$(=vQuarterEndDates)} >}SerialNbrItemQty)
Attached some pics.
Thanks in advanced.
Alex.
- Mark as New
- Bookmark
- Subscribe
- Mute
- Subscribe to RSS Feed
- Permalink
- Report Inappropriate Content
Difficult to give the exact expression which will work without a sample... but try this...
Sum({<Month_Date={$(=vQuarterEndDates)}>}
Aggr(
If(
InstallationDate >= QuarterStart(Min(TOTAL <[Account Name], Country, Period> MonthYear),0,11)
and
InstallationDate < QuarterStart(AddMonths(Max(TOTAL <[Account Name], Country, Period>MonthYear), 1), 0, 11)
, SerialNbrItemQty)
, [Account Name], Country, Period, InstallationDate))
- Mark as New
- Bookmark
- Subscribe
- Mute
- Subscribe to RSS Feed
- Permalink
- Report Inappropriate Content
Hi stalwar1,
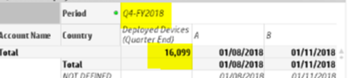
Now, it's even incorrect for 1 quarter (pic attached).
The idea is to have the following formula per quarter (Nov is the first month):
Q1-FY18 - sum({< InstallationDate={">=2017/11/01<2018/02/01"}, Month_Date={'2018/01/01','2018/04/01','2018/07/01','2018/10/01'}, [Employee country of origin]=, OriginSubRegion=, CurrentMonthTracking= >}SerialNbrItemQty)
Q2-FY18 - sum({< InstallationDate={">=2017/02/01<2018/05/01"}, Month_Date={'2018/01/01','2018/04/01','2018/07/01','2018/10/01'}, [Employee country of origin]=, OriginSubRegion=, CurrentMonthTracking= >}SerialNbrItemQty)
etc.
Thanks in advance.
- Mark as New
- Bookmark
- Subscribe
- Mute
- Subscribe to RSS Feed
- Permalink
- Report Inappropriate Content
Best.
Sunny
- Mark as New
- Bookmark
- Subscribe
- Mute
- Subscribe to RSS Feed
- Permalink
- Report Inappropriate Content
Hi stalwar1,
Attached the data model where I have a master calendar and the Fact table where SerialNbrItemQty and InstallationDate are.
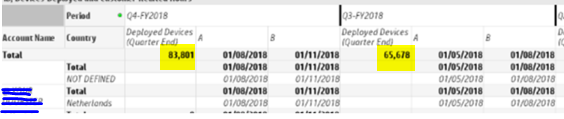
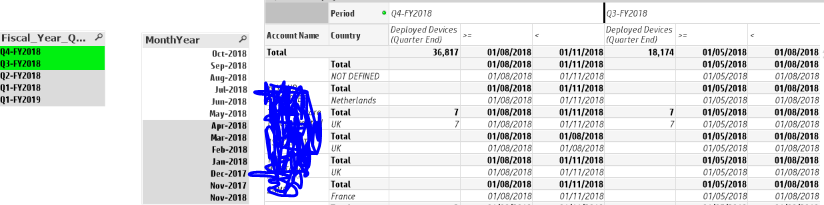
Filtering only by Q4 it shows correct results because the Date range is getting min/max MonthYear values for 3 months.
However, if I filter by Q3 and Q4 min/max values take now 6 months range instead of first 3 for Q3 and second 3 for Q4 so numbers are incorrect.
I have added columns >= and < per quarter to check if the set analysy was calculating date ranges per quarter as expected, and it is. Don't know why it's taking both quarters as the date range for both Q3 and Q4 then.
Thanks.