Unlock a world of possibilities! Login now and discover the exclusive benefits awaiting you.
- Qlik Community
- :
- Forums
- :
- Analytics
- :
- New to Qlik Analytics
- :
- Re: Dynamic Label for Dimensions/Measures?
- Subscribe to RSS Feed
- Mark Topic as New
- Mark Topic as Read
- Float this Topic for Current User
- Bookmark
- Subscribe
- Mute
- Printer Friendly Page
- Mark as New
- Bookmark
- Subscribe
- Mute
- Subscribe to RSS Feed
- Permalink
- Report Inappropriate Content
Dynamic Label for Dimensions/Measures?
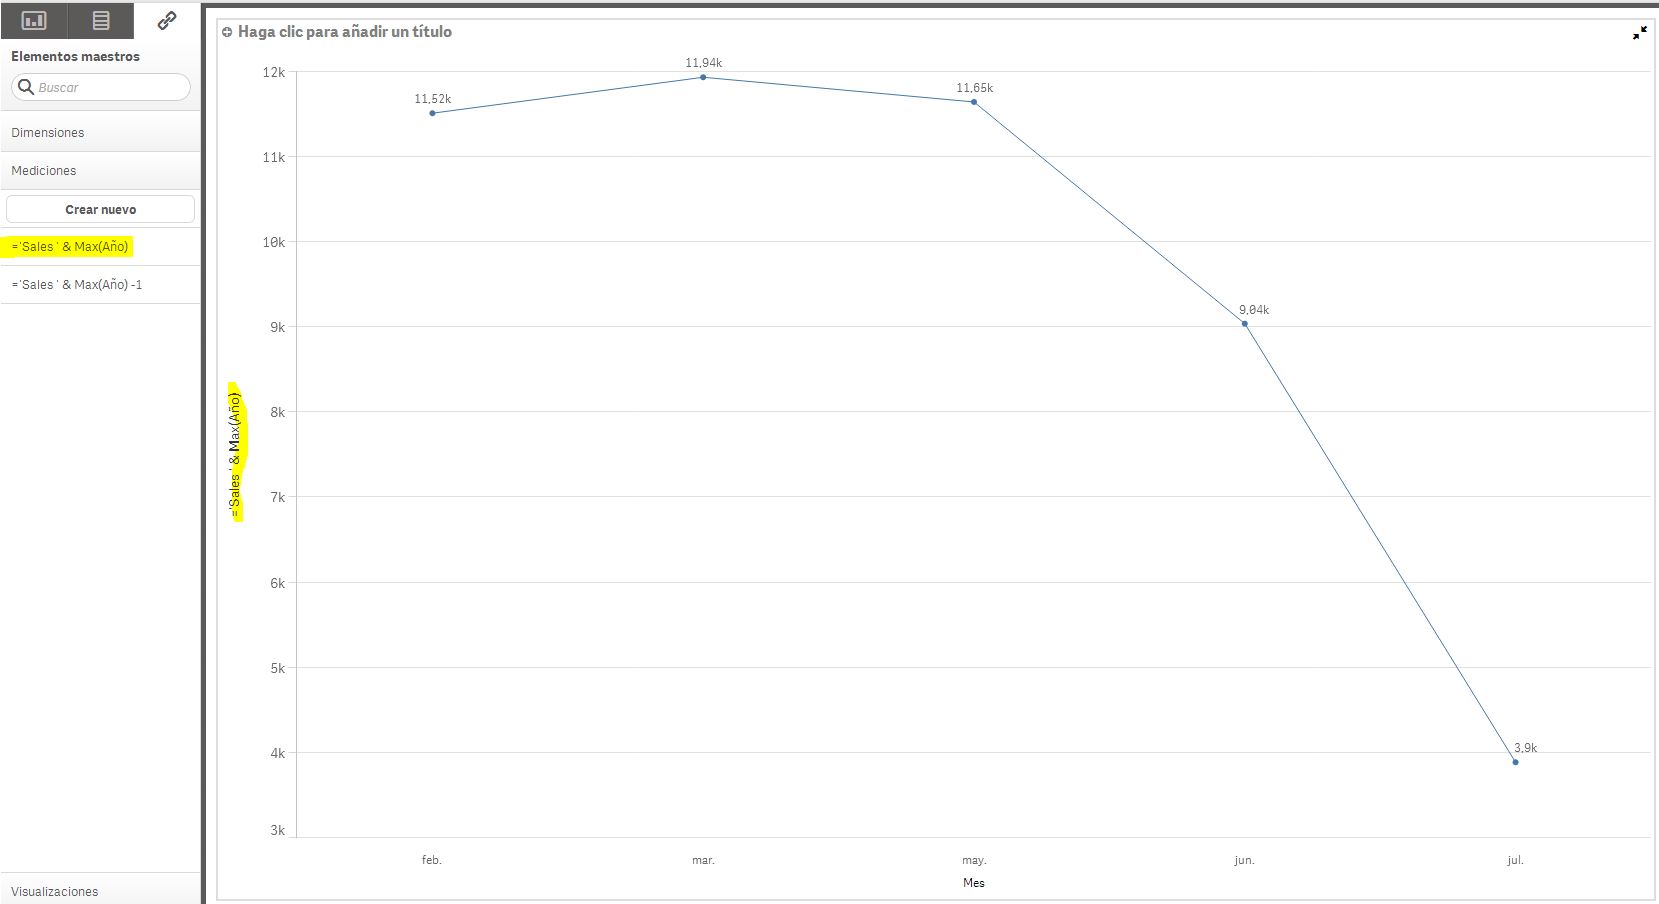
I'm using this label for a Measure:
= 'Sales ' & Max(Year)
I was expecting that the visualizations shows: Sales 2014, for example.
But, instead of this, it shows the formula: = 'Sales ' & Max(Year)
How can I get that dynamic label?

- « Previous Replies
- Next Replies »
Accepted Solutions
- Mark as New
- Bookmark
- Subscribe
- Mute
- Subscribe to RSS Feed
- Permalink
- Report Inappropriate Content
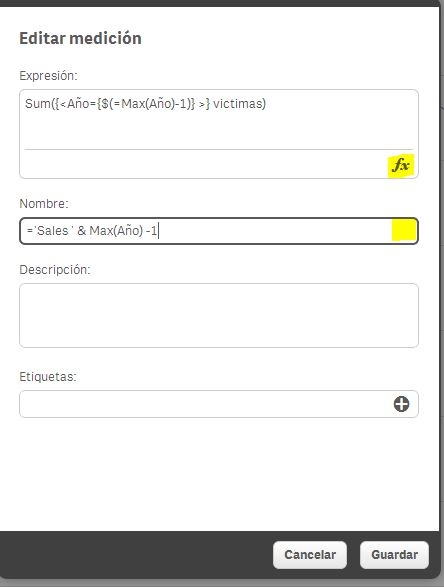
I have noticed that on the measure label editor, doesn't appears the Fx symbol, so may be it must be only plain text to show on it (not formulas)
I hope that on the next release, it could be changed

- Mark as New
- Bookmark
- Subscribe
- Mute
- Subscribe to RSS Feed
- Permalink
- Report Inappropriate Content
Hello,
I tried this, but this is not working in this version
Best regards.
Tonial.
- Mark as New
- Bookmark
- Subscribe
- Mute
- Subscribe to RSS Feed
- Permalink
- Report Inappropriate Content
I have noticed that on the measure label editor, doesn't appears the Fx symbol, so may be it must be only plain text to show on it (not formulas)
I hope that on the next release, it could be changed

- Mark as New
- Bookmark
- Subscribe
- Mute
- Subscribe to RSS Feed
- Permalink
- Report Inappropriate Content
That is correct. At this time the labels for measures are text only. The quick way to know what is text only and what can by dynamic is by looking for the "fx" button on the dialogue.
- Mark as New
- Bookmark
- Subscribe
- Mute
- Subscribe to RSS Feed
- Permalink
- Report Inappropriate Content
Thought it worth pointing out that you can use functions in the name of the chart. Not perfect, but suitable work arround for most uses.
- Mark as New
- Bookmark
- Subscribe
- Mute
- Subscribe to RSS Feed
- Permalink
- Report Inappropriate Content
I'm using latest version 2.1.1 and it still not available.
I need to use functions both in measures and dimensions because of multilanguages.
How can I do ?
- Mark as New
- Bookmark
- Subscribe
- Mute
- Subscribe to RSS Feed
- Permalink
- Report Inappropriate Content
Hello Josh
Is this functionality(dynamic expression label) still not a feature ?
- Mark as New
- Bookmark
- Subscribe
- Mute
- Subscribe to RSS Feed
- Permalink
- Report Inappropriate Content
- Mark as New
- Bookmark
- Subscribe
- Mute
- Subscribe to RSS Feed
- Permalink
- Report Inappropriate Content
I saw the extension, but it can't be used for a multilanguage app.
Simple I need to change pivot table labels based on which language has been chosen, ex. using the expression below:
=Minstring( {< Position = {"19_fatt_x_cli"} >} $(vLanguage) )
I taked a look also at the latest version 2.2 but this feature it's still unavailable!
- Mark as New
- Bookmark
- Subscribe
- Mute
- Subscribe to RSS Feed
- Permalink
- Report Inappropriate Content
Will this feature become available in the coming version 3.0 ?
- « Previous Replies
- Next Replies »