Unlock a world of possibilities! Login now and discover the exclusive benefits awaiting you.
- Qlik Community
- :
- Forums
- :
- Analytics
- :
- New to Qlik Analytics
- :
- Expression in bar charts with multidimension
Options
- Subscribe to RSS Feed
- Mark Topic as New
- Mark Topic as Read
- Float this Topic for Current User
- Bookmark
- Subscribe
- Mute
- Printer Friendly Page
Turn on suggestions
Auto-suggest helps you quickly narrow down your search results by suggesting possible matches as you type.
Showing results for
Contributor II
2018-09-25
10:23 AM
- Mark as New
- Bookmark
- Subscribe
- Mute
- Subscribe to RSS Feed
- Permalink
- Report Inappropriate Content
Expression in bar charts with multidimension
Hi,
I have a table like this:
| Year | Key | Field | Type | Value |
|---|---|---|---|---|
| 2008 | 001 | Object | A | 2 |
| 2008 | 001 | Object | B | 3 |
| 2008 | 001 | Player | A | 18 |
| 2008 | 001 | Player | B | 3 |
| 2008 | 001 | Book | A | 7 |
| 2008 | 001 | Book | B | 12 |
| ... | ... | ... | ... | ... |
and I want to creare a "Horizontal Stacked Bar Chart" with dimension:
Stack = Key
Bar = Field
and measures:
(Sum(Value)/sum(total(Value)))
Measures need to show the percent.
It show in this way:
.png)
but I need to show something like this:
.png)
I think that I need to modify the Measure expression to calculate the percent in a way that is right to take the full value, but I don't know how.
Thanks to all 
525 Views
2 Replies
Partner - Champion
2018-09-25
11:07 AM
- Mark as New
- Bookmark
- Subscribe
- Mute
- Subscribe to RSS Feed
- Permalink
- Report Inappropriate Content
could you attach a sample app woth mock data?
491 Views
Partner - Master III
2018-09-25
01:43 PM
- Mark as New
- Bookmark
- Subscribe
- Mute
- Subscribe to RSS Feed
- Permalink
- Report Inappropriate Content
try this Sum(Value)/sum(total<Key> Value)
personal e.g. below
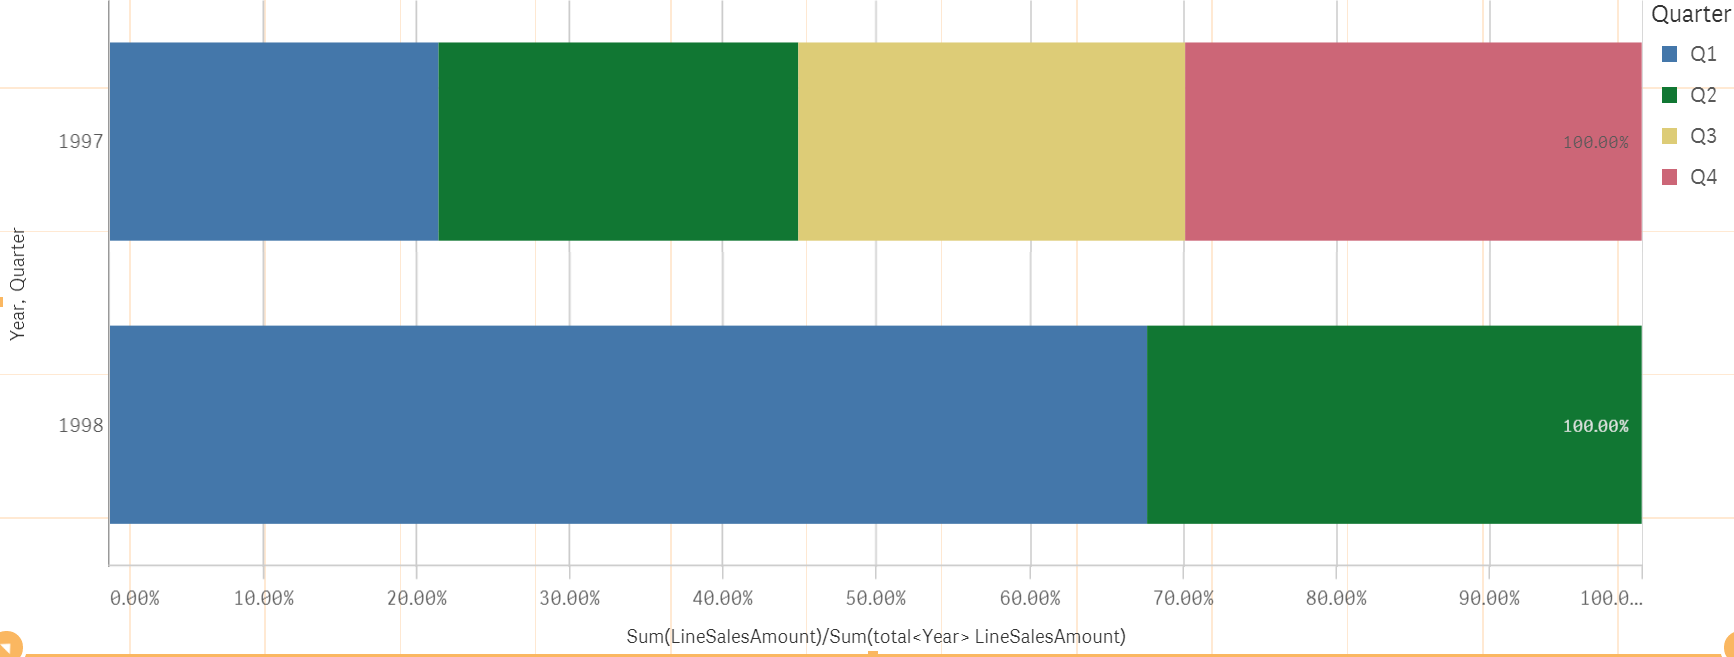
Sum(LineSalesAmount)/Sum(total<Year> LineSalesAmount)
Year is the stack
491 Views
Community Browser