Unlock a world of possibilities! Login now and discover the exclusive benefits awaiting you.
Announcements
Join us at Qlik Connect for 3 magical days of learning, networking,and inspiration! REGISTER TODAY and save!
- Qlik Community
- :
- Forums
- :
- Analytics
- :
- New to Qlik Analytics
- :
- Fill the color of bar till a particular value
Options
- Subscribe to RSS Feed
- Mark Topic as New
- Mark Topic as Read
- Float this Topic for Current User
- Bookmark
- Subscribe
- Mute
- Printer Friendly Page
Turn on suggestions
Auto-suggest helps you quickly narrow down your search results by suggesting possible matches as you type.
Showing results for
Contributor II
2019-12-02
07:39 AM
- Mark as New
- Bookmark
- Subscribe
- Mute
- Subscribe to RSS Feed
- Permalink
- Report Inappropriate Content
Fill the color of bar till a particular value
HI,
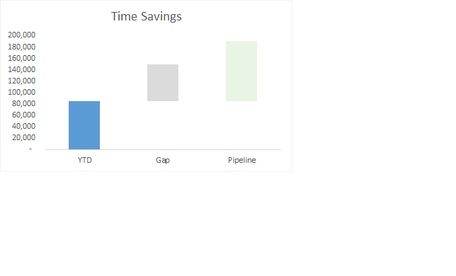
I'm trying to create a barchart as shown below. In excel I can color the lower block white to show it starting from a particular value.
Below is how it should look after I color lower bar as white. 
Can anyone please let me know how to achieve this in Qliksense?
- Tags:
- chart
911 Views
3 Replies
MVP
2019-12-02
08:46 AM
- Mark as New
- Bookmark
- Subscribe
- Mute
- Subscribe to RSS Feed
- Permalink
- Report Inappropriate Content
Did you try this with the waterfall chart in Qlik Sense?
897 Views
Contributor II
2019-12-03
02:25 AM
Author
- Mark as New
- Bookmark
- Subscribe
- Mute
- Subscribe to RSS Feed
- Permalink
- Report Inappropriate Content
Yes but not sure how I can make third bar to start from same point where second bar starts and give different color to each bar when all the bars are selected as 'Add'.
869 Views
MVP
2019-12-03
06:22 AM
- Mark as New
- Bookmark
- Subscribe
- Mute
- Subscribe to RSS Feed
- Permalink
- Report Inappropriate Content
Would you be able to share a sample where you have loaded the data?
855 Views
Community Browser
