Unlock a world of possibilities! Login now and discover the exclusive benefits awaiting you.
- Qlik Community
- :
- Forums
- :
- Analytics
- :
- New to Qlik Analytics
- :
- Filter the row value based on the selection in qli...
- Subscribe to RSS Feed
- Mark Topic as New
- Mark Topic as Read
- Float this Topic for Current User
- Bookmark
- Subscribe
- Mute
- Printer Friendly Page
- Mark as New
- Bookmark
- Subscribe
- Mute
- Subscribe to RSS Feed
- Permalink
- Report Inappropriate Content
Filter the row value based on the selection in qliksense
Hi all,
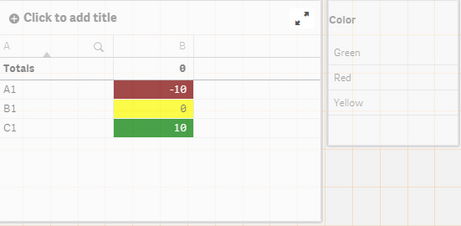
i want to filter the rows based on the selection like i have one table chart which is having 2 columns A and B in and another one is filter pane which is having 3 values red, yellow and Green so what my requirement is if i select red then it should show only negative values rows and hides rest of all but both the table doesn't have any relationship
i have attached screenshot for your reference.
so can anyone help me to sort out this one...
Accepted Solutions
- Mark as New
- Bookmark
- Subscribe
- Mute
- Subscribe to RSS Feed
- Permalink
- Report Inappropriate Content
Hey,
Load script:
Date:
load * inline [
Label, Value
A1, -10
B1, 0
C1, 10
];
DateWithColor:
Load
Label,
Value,
if(Value = 0, 'Yellow',
if(Value < 0, 'Red',
'Green')) as Color
Resident Date;
Drop Table Date;
Result:

