Unlock a world of possibilities! Login now and discover the exclusive benefits awaiting you.
- Qlik Community
- :
- Forums
- :
- Analytics
- :
- New to Qlik Analytics
- :
- Re: Fiscal Year/Graph question
- Subscribe to RSS Feed
- Mark Topic as New
- Mark Topic as Read
- Float this Topic for Current User
- Bookmark
- Subscribe
- Mute
- Printer Friendly Page
- Mark as New
- Bookmark
- Subscribe
- Mute
- Subscribe to RSS Feed
- Permalink
- Report Inappropriate Content
Fiscal Year/Graph question
Hi,
I have the following chart which shows unit openings by month:
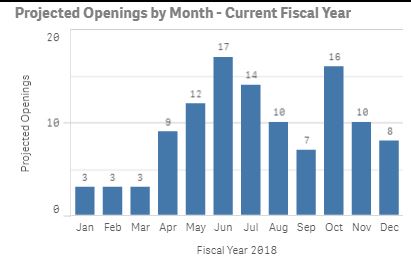
However, our fiscal year begins 1/31/17, so the data shown for Jan above (3 units) actually is January 2018. I'm currently using the expression : =[Opening Date.autoCalendar.Month] as the dimension, and the expression Count(DISTINCT {<[PS Number] = {"=[Opening Date]> '1/31/2017' and [Opening Date]< '1/30/2018'"}>} [PS Number]) as the measure.
I would like the above chart to start in February, then end in Jan (i.e. show January after Dec on the right) to properly show the sequence of months as it relates to our fiscal calendar.
I've searched and read some posts related to defining Fiscal Year on this site, but those posts are confusing.
Can someone please assist? Thanks in advance!
- « Previous Replies
-
- 1
- 2
- Next Replies »
Accepted Solutions
- Mark as New
- Bookmark
- Subscribe
- Mute
- Subscribe to RSS Feed
- Permalink
- Report Inappropriate Content
Hi Mike,
I would suggest another solution.
Load Fiscal Month column as a dual value Dual(Text,Number) as Fiscal Month
where your Feb will be represented by 1,March as 2 and so on.... up until Jan which will be represented by 12
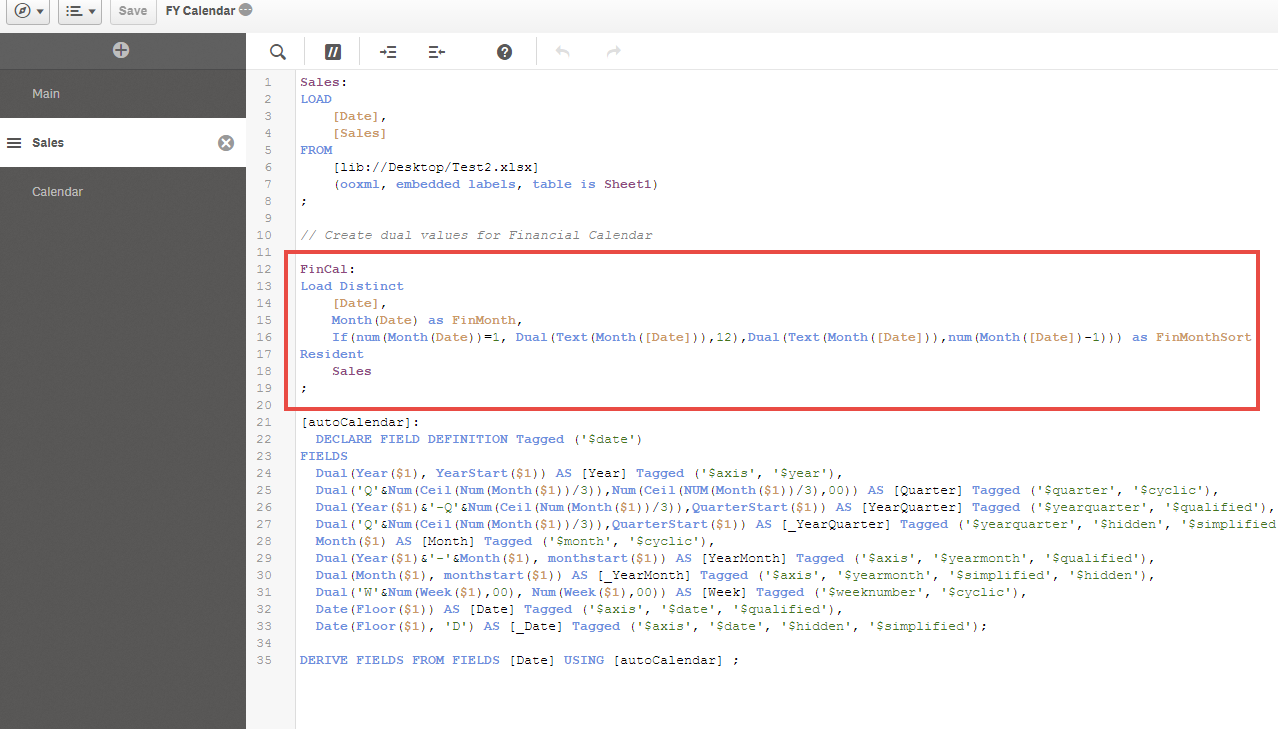
See script i have suggested (basicly you are offsetiiing months by defined number)
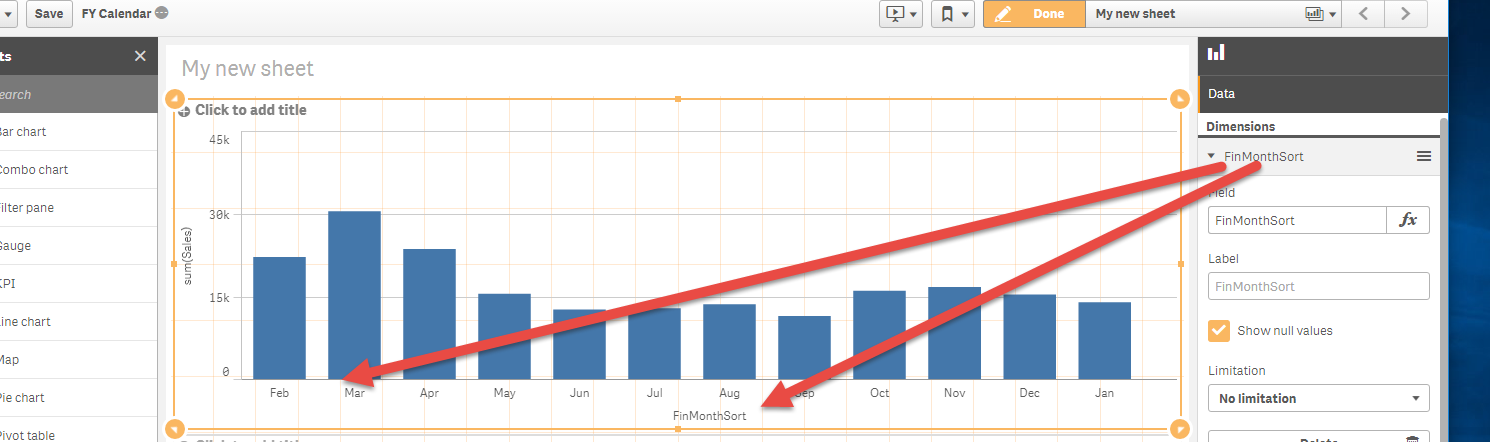
then you can sort it numericaly in your chart expression as the smallest is Feb and the biggest Jan.
look at screenshots and sample app with sample data in XLS
regards
Lech

See solution in qvf file:
- Mark as New
- Bookmark
- Subscribe
- Mute
- Subscribe to RSS Feed
- Permalink
- Report Inappropriate Content
go to sort tab and choose expression. then add Opening Date or Opening Year (If you have) as sorting option.
- Mark as New
- Bookmark
- Subscribe
- Mute
- Subscribe to RSS Feed
- Permalink
- Report Inappropriate Content
Thanks for your reply, John.
That approach did not work. Here is a snip of my screen:
Those openings in Jan are January 2018, so when I use the expression "autocalendar open date", then sort in ascending order, then January, 2018 should show AFTER all the other months (all of which have open dates in 2017)...
Thanks, again
- Mark as New
- Bookmark
- Subscribe
- Mute
- Subscribe to RSS Feed
- Permalink
- Report Inappropriate Content
Hi Mike,
have issue with my qlik sense now I only have qlikview.
so i can't check why it isn't working for now.
however, dont you need to activate custom option in the image?
- Mark as New
- Bookmark
- Subscribe
- Mute
- Subscribe to RSS Feed
- Permalink
- Report Inappropriate Content
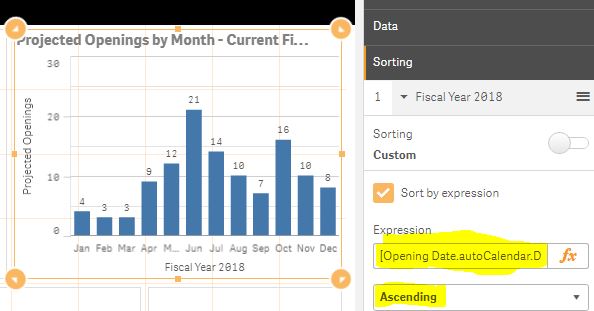
And interestingly, when I try to sort using the expression "Opening Date.autocalendar.year", it moves the month of April out of the correct sequence - otherwise all the other months are displayed correctly:
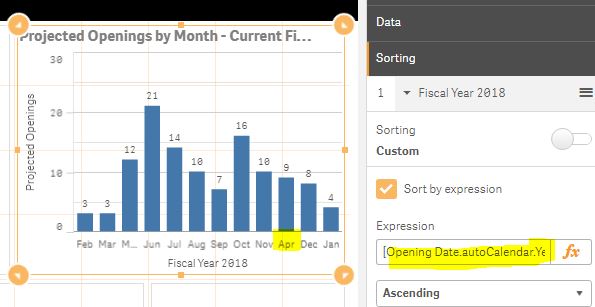
I checked the data vales for those in April, and those dates are displayed correctly.
Thanks....
- Mark as New
- Bookmark
- Subscribe
- Mute
- Subscribe to RSS Feed
- Permalink
- Report Inappropriate Content
John,
No, I think custom is active when slider is to the left, and "auto is active when slid to the right...
- Mark as New
- Bookmark
- Subscribe
- Mute
- Subscribe to RSS Feed
- Permalink
- Report Inappropriate Content
Hi Mike,
I would suggest another solution.
Load Fiscal Month column as a dual value Dual(Text,Number) as Fiscal Month
where your Feb will be represented by 1,March as 2 and so on.... up until Jan which will be represented by 12
See script i have suggested (basicly you are offsetiiing months by defined number)
then you can sort it numericaly in your chart expression as the smallest is Feb and the biggest Jan.
look at screenshots and sample app with sample data in XLS
regards
Lech
See solution in qvf file:
- Mark as New
- Bookmark
- Subscribe
- Mute
- Subscribe to RSS Feed
- Permalink
- Report Inappropriate Content
Lech,
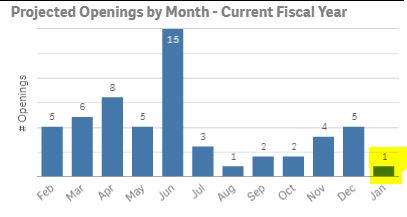
Thank You - this is helpful. It appears I have the months sorted in the correct order, but now my Measure is not accurate.
Here's the graph, in the correct order but showing Jan with 1 opening:
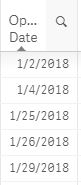
Here is portion of the data with 5 Jan 2018 openings:
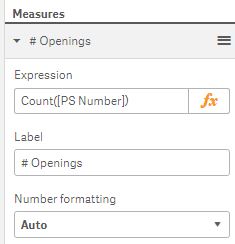
And here is my Measure calculation:
Many thanks!
- Mark as New
- Bookmark
- Subscribe
- Mute
- Subscribe to RSS Feed
- Permalink
- Report Inappropriate Content
Hi Mike,
I can only assume that you have not linked data properly. Here are possible causes:
- you have linke date field in your fact table with fiscal date in your calendar (this will actually show December data as January - which i assume is a case in here). If you look at my solution, I still link data using just regular dates and i only use offseted Fiscal Year/Month field as a dimension in a chart.
- your date formats are not recognised properly by qlik sense - that will require some tweaking on script.
Are you able to share xls and qvf file so i can look at it? That would be the most efficient way of solving your issue.
regards
Lech
- Mark as New
- Bookmark
- Subscribe
- Mute
- Subscribe to RSS Feed
- Permalink
- Report Inappropriate Content
Thanks, Lech..I will look at these items. If I cannot solve it myself, I'll look at sharing my qvf file. But, that might 24 hours (or so) from now....I'll keep you posted..and thanks again!
- « Previous Replies
-
- 1
- 2
- Next Replies »