Unlock a world of possibilities! Login now and discover the exclusive benefits awaiting you.
- Qlik Community
- :
- Forums
- :
- Analytics
- :
- New to Qlik Analytics
- :
- Re: Gradients in pivot table
- Subscribe to RSS Feed
- Mark Topic as New
- Mark Topic as Read
- Float this Topic for Current User
- Bookmark
- Subscribe
- Mute
- Printer Friendly Page
- Mark as New
- Bookmark
- Subscribe
- Mute
- Subscribe to RSS Feed
- Permalink
- Report Inappropriate Content
Gradients in pivot table
Hi folks hope you are well and would appreciate your help here
I want to apply color gradients like you can in excel to a pivot table in Qlik. Is it doable? Depending on the measure it needs to be red to green or green to red. I have attached an example of my desired output and the app so you can see what I have done, really appreciated thanks
- « Previous Replies
-
- 1
- 2
- Next Replies »
Accepted Solutions
- Mark as New
- Bookmark
- Subscribe
- Mute
- Subscribe to RSS Feed
- Permalink
- Report Inappropriate Content
Hi Matt
In your TCD
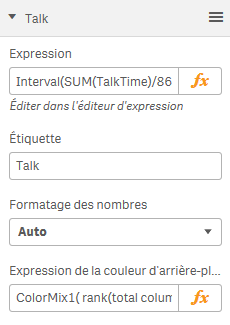
select your mesure then add this in the back ground color panel this expression :
ColorMix1( rank(total column(1))/noofrows(TOTAL) , lightgreen(),lightred())

You will get this
for talk :
ColorMix1( rank(total column(1))/noofrows(TOTAL) , lightgreen(),lightred())
for Pause :
ColorMix1( rank(total column(1))/noofrows(TOTAL) , lightred(),lightgreen())
For % conversation :
ColorMix1( rank(total column(1))/noofrows(TOTAL) , lightgreen(),lightred())

hope it helps
- Mark as New
- Bookmark
- Subscribe
- Mute
- Subscribe to RSS Feed
- Permalink
- Report Inappropriate Content
Hi Matt
In your TCD
select your mesure then add this in the back ground color panel this expression :
ColorMix1( rank(total column(1))/noofrows(TOTAL) , lightgreen(),lightred())

You will get this
for talk :
ColorMix1( rank(total column(1))/noofrows(TOTAL) , lightgreen(),lightred())
for Pause :
ColorMix1( rank(total column(1))/noofrows(TOTAL) , lightred(),lightgreen())
For % conversation :
ColorMix1( rank(total column(1))/noofrows(TOTAL) , lightgreen(),lightred())

hope it helps
- Mark as New
- Bookmark
- Subscribe
- Mute
- Subscribe to RSS Feed
- Permalink
- Report Inappropriate Content
Mate THANKS
That is beyond cool and I learnt something too. I wish you well it looks great ![]()
- Mark as New
- Bookmark
- Subscribe
- Mute
- Subscribe to RSS Feed
- Permalink
- Report Inappropriate Content
Hi Someone Can Help me about a similar question?
I'm working on a qliksense document. I need to color the pivot table according to the measurament: Incidenza Ordini su Totale
Logics to color: the major in green and the worst in red (with the shades of colour in the centre).
I attach the qliksense app and the picture of what I want to replicate with qliksense. !
shades of colour in pivot table
I tried to use this formula
ColorMix1( rank(total column(1))/noofrows(TOTAL) , lightgreen(),lightred()) but the colour is not ok.
Thanks Anna
- Mark as New
- Bookmark
- Subscribe
- Mute
- Subscribe to RSS Feed
- Permalink
- Report Inappropriate Content
Hi
see my response below and in your post
Hello Anna Maria
May be this way :
ColorMix1( hrank(total column(1))/NoOfColumns(TOTAL) , lightgreen(),lightred())
replace renk by hrank and NoofRows by NoOfColumns
See below and chek if it's OK with desired outpout :
- Mark as New
- Bookmark
- Subscribe
- Mute
- Subscribe to RSS Feed
- Permalink
- Report Inappropriate Content
!Hi Bruno!!
I know that it's was closed 1 year ago. But I'm trying to solve a similar situation.
I attached my APP to help.
I have somw rows with different expression to calc for each, I need to colour my higher in red, medium yellow and lower green, also their gradients.
Could you help me?
- Mark as New
- Bookmark
- Subscribe
- Mute
- Subscribe to RSS Feed
- Permalink
- Report Inappropriate Content
Hi Antonio
I tried to applys the colormix function in your model but it does'nt work due to your pivot table structure
Colormix works in Pivot table with one mesure and dimension in row and column
I wiil try another way but not sure to sucess in
Regards
- Mark as New
- Bookmark
- Subscribe
- Mute
- Subscribe to RSS Feed
- Permalink
- Report Inappropriate Content
Hi Bruno!!
Do you suggest another object to display the same view?
Ok!! I'm waiting for your another solution. I hope with sucess.
Thank you!!
- Mark as New
- Bookmark
- Subscribe
- Mute
- Subscribe to RSS Feed
- Permalink
- Report Inappropriate Content
Bruno,
Any news?
- Mark as New
- Bookmark
- Subscribe
- Mute
- Subscribe to RSS Feed
- Permalink
- Report Inappropriate Content
Hi Bruno!
Sorry for texting again, but that is making me crazy kkk!
Tks a lot!
- « Previous Replies
-
- 1
- 2
- Next Replies »