- Mark as New
- Bookmark
- Subscribe
- Mute
- Subscribe to RSS Feed
- Permalink
- Report Inappropriate Content
Grouping data from day to month
Hi,
how can I regroup and count the number of times of item 1 by per month?

expected result
03.2018 | 6
04.2018 | 23
05.2018 | 4
There is more than 1 items to group but I think if I am able to group this. the rest shall be group automatically.
Accepted Solutions
- Mark as New
- Bookmark
- Subscribe
- Mute
- Subscribe to RSS Feed
- Permalink
- Report Inappropriate Content
Hi,
Try this:
Aggr(count(Distinct [TRANSACTION_DATE.autoCalendar.Date]), TRANSACTION_DATE.autoCalendar.YearMonth, Item)
Hope this helps,
Justin.
- Mark as New
- Bookmark
- Subscribe
- Mute
- Subscribe to RSS Feed
- Permalink
- Report Inappropriate Content
It will depend on your data what is the best way.
If you load using data manager, it will create a YearMonth field which you can use as a dimension or create your own calendar.
You should also have a reference per order of each that you could count.
so table would have
Item YearMonth Count(OrderRef)
- Mark as New
- Bookmark
- Subscribe
- Mute
- Subscribe to RSS Feed
- Permalink
- Report Inappropriate Content
I am not using Data manger.
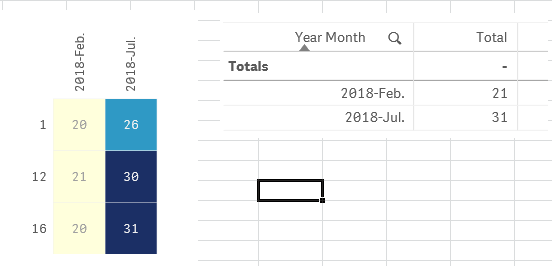
After some attempt using the Expression
Aggr(count(Distinct [TRANSACTION_DATE.autoCalendar.Date]), TRANSACTION_DATE.autoCalendar.YearMonth)
I am now getting biggest record instead of the total sold for the month.
What is wrong with my express?

- Mark as New
- Bookmark
- Subscribe
- Mute
- Subscribe to RSS Feed
- Permalink
- Report Inappropriate Content
i am little unclear on the problem. i am assuming you want the total sold for the month
2 questions
- why are you counting the transaction dates? instead of transactionid or something similar
- you seem to have a master/autocalendar - instead of using aggr - just use YearMonth as the dimension simple count function as the measure
- Mark as New
- Bookmark
- Subscribe
- Mute
- Subscribe to RSS Feed
- Permalink
- Report Inappropriate Content
The criteria is a bit unique here. I need to count the sold item as 1 for the day instead of total sold per day.
and with that 1 count per day, I need to summarize the total of date counted by months.
For ex. item 1 sold 18 on 2-Jan-2018. the count will become 1 for 2-Jan-2018 and so on.
I have already use the YearMonth dimension but see the monthly chart is not the sum for all items.
- Mark as New
- Bookmark
- Subscribe
- Mute
- Subscribe to RSS Feed
- Permalink
- Report Inappropriate Content
Hi,
Try this:
Aggr(count(Distinct [TRANSACTION_DATE.autoCalendar.Date]), TRANSACTION_DATE.autoCalendar.YearMonth, Item)
Hope this helps,
Justin.
- Mark as New
- Bookmark
- Subscribe
- Mute
- Subscribe to RSS Feed
- Permalink
- Report Inappropriate Content
Hi Justin.
This is working. thanks!