Unlock a world of possibilities! Login now and discover the exclusive benefits awaiting you.
- Qlik Community
- :
- Forums
- :
- Analytics
- :
- New to Qlik Analytics
- :
- Re: Help in formula for Max of an axis
- Subscribe to RSS Feed
- Mark Topic as New
- Mark Topic as Read
- Float this Topic for Current User
- Bookmark
- Subscribe
- Mute
- Printer Friendly Page
- Mark as New
- Bookmark
- Subscribe
- Mute
- Subscribe to RSS Feed
- Permalink
- Report Inappropriate Content
Help in formula for Max of an axis
Hello,
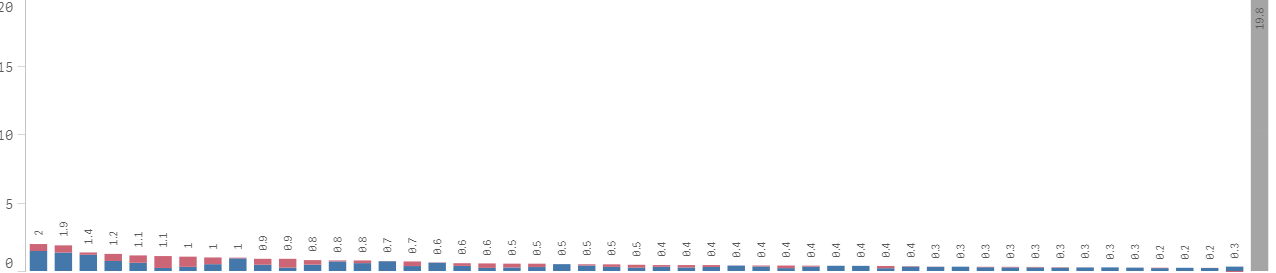
I have a stacked bar chart (snippet below) which has values ranging from 2 to 0. I have to limit the graph to show top 50 values and then if needed drill down into others.
Right now, when I do that, the axis is changing to the max value of "Others" which I do not want. Is there some formula (I hope there is) so that we can set the max of the Y axis to the aggregate (in my example 2).
Thanks in advance.
- Tags:
- axis
Accepted Solutions
- Mark as New
- Bookmark
- Subscribe
- Mute
- Subscribe to RSS Feed
- Permalink
- Report Inappropriate Content
May be like this:
Max(Aggr(YourExpression, ChartDimension))
or
Max({1}Aggr(YourExpression, ChartDimension))
Ignore selection in yourExpression also adding 1 to it -> {1<.....>}
- Mark as New
- Bookmark
- Subscribe
- Mute
- Subscribe to RSS Feed
- Permalink
- Report Inappropriate Content
May be like this:
Max(Aggr(YourExpression, ChartDimension))
or
Max({1}Aggr(YourExpression, ChartDimension))
Ignore selection in yourExpression also adding 1 to it -> {1<.....>}
- Mark as New
- Bookmark
- Subscribe
- Mute
- Subscribe to RSS Feed
- Permalink
- Report Inappropriate Content
That perfectly did it. Would you know how to round it up?
P.S: Already happy with this 
- Mark as New
- Bookmark
- Subscribe
- Mute
- Subscribe to RSS Feed
- Permalink
- Report Inappropriate Content
Figured it out. Used the round. Thanks a bunch
- Mark as New
- Bookmark
- Subscribe
- Mute
- Subscribe to RSS Feed
- Permalink
- Report Inappropriate Content
Awesome
- Mark as New
- Bookmark
- Subscribe
- Mute
- Subscribe to RSS Feed
- Permalink
- Report Inappropriate Content
Can u explain me how to use above mentioned formula use in my chart.
My expression is :
((SUM({<JRNAL_TYPE={'ZHI01'},Flag={"$(vFlag)"}, [Account Type]={'P'} ,[Debit Credit]={'C'}, [Transaction Date]={">=$(vMonthStartMaxDate)<=$(vMaxTransDate)"}, FiscalMonthName= , FiscalYear= >}[Transaction Amount])
+
(-1*SUM({<JRNAL_TYPE={'ZHI01'},Flag={"$(vFlag)"}, [Account Type]={'P'} ,[Debit Credit]={'D'}, [Transaction Date]={">=$(vMonthStartMaxDate)<=$(vMaxTransDate)"}, FiscalMonthName= , FiscalYear= >}[Transaction Amount]))
)
/
100000
)