Unlock a world of possibilities! Login now and discover the exclusive benefits awaiting you.
- Qlik Community
- :
- Forums
- :
- Analytics
- :
- New to Qlik Analytics
- :
- How Can I added upper and lower arrow indicators i...
- Subscribe to RSS Feed
- Mark Topic as New
- Mark Topic as Read
- Float this Topic for Current User
- Bookmark
- Subscribe
- Mute
- Printer Friendly Page
- Mark as New
- Bookmark
- Subscribe
- Mute
- Subscribe to RSS Feed
- Permalink
- Report Inappropriate Content
How Can I added upper and lower arrow indicators in Qlik Snese
Hello.
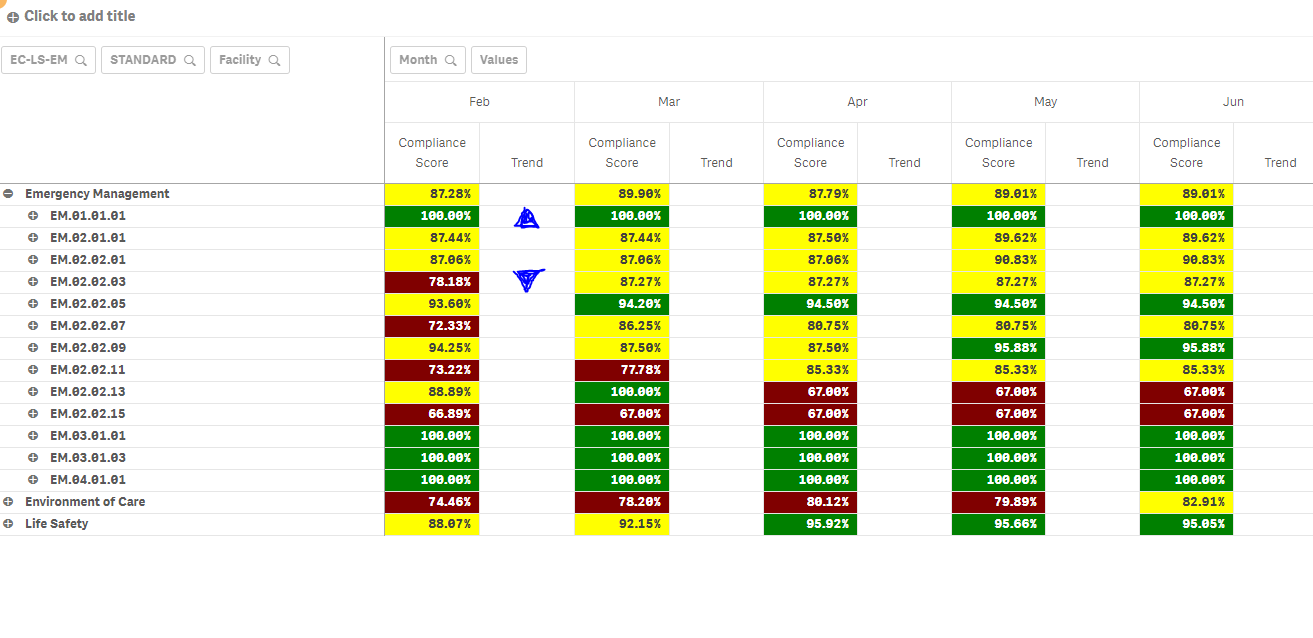
I have a pivot chart showing some scores and I have a trend column that I want to add arrow indicators. So like I change the colors for the different scores using this expression:
If(
Alt(Sum(Score)/Count({<Score={">0"}>}[Record ID])/3,0)>0.95,Green(),
If(Alt(Sum(Score)/Count({<Score={">0"}>}[Record ID])/3,0)>0.8,Yellow(),
If(Alt(Sum(Score)/Count({<Score={">0"}>}[Record ID])/3,0)>0,Red(),
DarkGray())))
So I was wondering if there was something like that I can do to add indicators to one of the columns?
Thanks!
Lizzy
Accepted Solutions
- Mark as New
- Bookmark
- Subscribe
- Mute
- Subscribe to RSS Feed
- Permalink
- Report Inappropriate Content
- Mark as New
- Bookmark
- Subscribe
- Mute
- Subscribe to RSS Feed
- Permalink
- Report Inappropriate Content
- Mark as New
- Bookmark
- Subscribe
- Mute
- Subscribe to RSS Feed
- Permalink
- Report Inappropriate Content
Hi,
Thank you! I got it working, but how can I also change the colors of the arrows?
So now I'm using this:
If(
Alt(Sum(Score)/Count({<Score={">0"}>}[Record ID])/3,0)>0.95,chr(9650),
If(Alt(Sum(Score)/Count({<Score={">0"}>}[Record ID])/3,0)>0.8,chr(8594),
If(Alt(Sum(Score)/Count({<Score={">0"}>}[Record ID])/3,0)>0,chr(9660),
DarkGray())))
- Mark as New
- Bookmark
- Subscribe
- Mute
- Subscribe to RSS Feed
- Permalink
- Report Inappropriate Content
Never mind, I got the colors working too. THANK YOU!
- Mark as New
- Bookmark
- Subscribe
- Mute
- Subscribe to RSS Feed
- Permalink
- Report Inappropriate Content
1. Add a new measure to the Pivot Chart for Trend indicators
2. Try expression like If(Alt(Sum(Score)/Count({<Score={">0"}>}[Record ID])/3,0)>0.8,Chr(9650),Chr(9660))
3.In Text Color expression try
If(
Alt(Sum(Score)/Count({<Score={">0"}>}[Record ID])/3,0)>0.95,Green(),
If(Alt(Sum(Score)/Count({<Score={">0"}>}[Record ID])/3,0)>0.8,Yellow(),
If(Alt(Sum(Score)/Count({<Score={">0"}>}[Record ID])/3,0)>0,Red(),
DarkGray())))
Hope this Helps!