Unlock a world of possibilities! Login now and discover the exclusive benefits awaiting you.
- Qlik Community
- :
- Forums
- :
- Analytics
- :
- New to Qlik Analytics
- :
- Re: How can I make font or chart colour conditiona...
- Subscribe to RSS Feed
- Mark Topic as New
- Mark Topic as Read
- Float this Topic for Current User
- Bookmark
- Subscribe
- Mute
- Printer Friendly Page
- Mark as New
- Bookmark
- Subscribe
- Mute
- Subscribe to RSS Feed
- Permalink
- Report Inappropriate Content
How can I make font or chart colour conditional in Qlik Sense?
Hello,
Is there any way to make the colour of the font in a text chart (or even better the background colour itself) change in accordance with the calculation?
For example, if the expression delivers a minus amount I would like this to show in RED, if the expression delivers a plus amount I would like this in GREEN.
I have found calculation for QLIK View but it does not work, it just replaces the calculation with words RED or GREEN. Below if the calculation I tried on a text chart.
if((Sum({$<[Requisition Status]={Closed}>}[Number of Filled Reqs])-1)>0,'Green','Red')
Thanks,
Kizzy
- « Previous Replies
-
- 1
- 2
- Next Replies »
Accepted Solutions
- Mark as New
- Bookmark
- Subscribe
- Mute
- Subscribe to RSS Feed
- Permalink
- Report Inappropriate Content
I see, I misunderstood. You are using a "Text & Image" object which does not provide for conditional colors. You might try switching to a KPI object which does provide conditional color.
-Rob
- Mark as New
- Bookmark
- Subscribe
- Mute
- Subscribe to RSS Feed
- Permalink
- Report Inappropriate Content
You could use similar for BG and Font color in text object. But, The statement you are creating flag not the function. Perhaps this?
if((Sum({$<[Requisition Status]={Closed}>}[Number of Filled Reqs])-1)>0,Green(),Red())
- Mark as New
- Bookmark
- Subscribe
- Mute
- Subscribe to RSS Feed
- Permalink
- Report Inappropriate Content
Hi Anil,
Please could provide instructions on how to do this.
Thanks,
Kizzy
- Mark as New
- Bookmark
- Subscribe
- Mute
- Subscribe to RSS Feed
- Permalink
- Report Inappropriate Content
Not sure, What instruction you are expecting here? If you want to work then i would request application
- Mark as New
- Bookmark
- Subscribe
- Mute
- Subscribe to RSS Feed
- Permalink
- Report Inappropriate Content
Hi Anil,
How to insert a Text Object and add an expression to make it change colour based on the result of the expression. I have looked at other questions on the same topic and they say that text objects cannot be conditionally coloured.
Thanks,
Kizzy
- Mark as New
- Bookmark
- Subscribe
- Mute
- Subscribe to RSS Feed
- Permalink
- Report Inappropriate Content
I think, there is limit Options using that? Can you share application Will test the same
- Mark as New
- Bookmark
- Subscribe
- Mute
- Subscribe to RSS Feed
- Permalink
- Report Inappropriate Content
Hi Kizzy,
Please share the application , we will surely provide the solution to you.
Regards
Kamal
- Mark as New
- Bookmark
- Subscribe
- Mute
- Subscribe to RSS Feed
- Permalink
- Report Inappropriate Content
Hi Kamal,
I am unable to share as some of the data contains employee data. Is there any other way this can be resolved?
Thanks,
Kizzy
- Mark as New
- Bookmark
- Subscribe
- Mute
- Subscribe to RSS Feed
- Permalink
- Report Inappropriate Content
You posted a Qlik Sense question in a forum called "New to QlikView".
If you want more feedback from Qlik Sense experts, you may want to move this discussion to the New to Qlik Sense forum by following the steps outlined here: QlikCommunity Tip: How to move your discussion thread
Thanks.
- Mark as New
- Bookmark
- Subscribe
- Mute
- Subscribe to RSS Feed
- Permalink
- Report Inappropriate Content
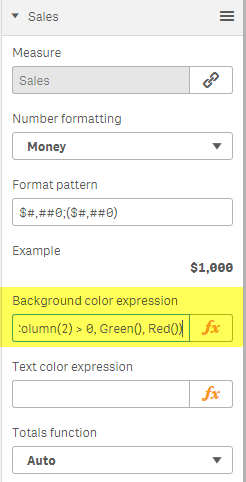
For a table chart, use the Background Color property. The value should be a color function eg Red() as Anil showed in his example.
Note that if you are testing a value in a column, there is no need to repeat the expression that calculated the value. You can use the column(n) function as a shortcut.
if(Column(2) > 0, Green(), Red())
The first Measure column is 1, the second 2 and so on.

-Rob
- « Previous Replies
-
- 1
- 2
- Next Replies »