Unlock a world of possibilities! Login now and discover the exclusive benefits awaiting you.
- Qlik Community
- :
- Forums
- :
- Analytics
- :
- New to Qlik Analytics
- :
- Re: How can you calculate the variance of two colu...
- Subscribe to RSS Feed
- Mark Topic as New
- Mark Topic as Read
- Float this Topic for Current User
- Bookmark
- Subscribe
- Mute
- Printer Friendly Page
- Mark as New
- Bookmark
- Subscribe
- Mute
- Subscribe to RSS Feed
- Permalink
- Report Inappropriate Content
How can you calculate the variance of two columns in a pivot table?
Hi,
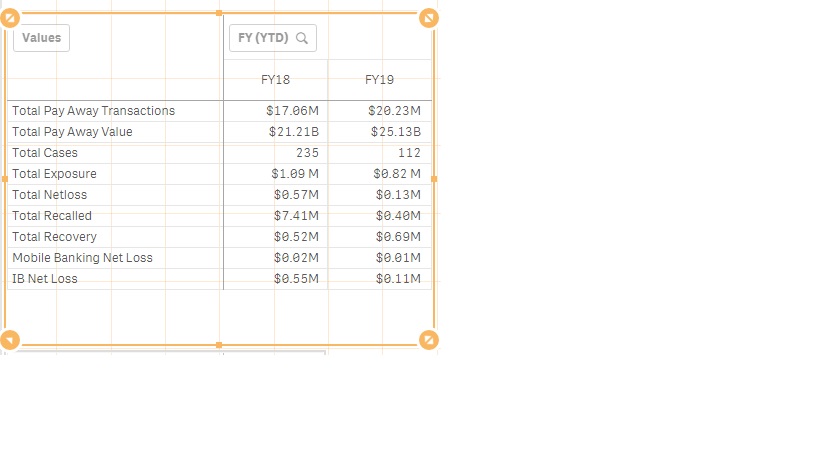
I have created a pivot table which has values as the rows and the financial year (FY18, FY19, etc) as the columns. I have calculated the different values as shown in the attachment. I am trying to insert a variance column after the FY19 column that calculates the variance between FY18 and FY19. Does anybody know how I can do that?
Any help on this would be much appreciated!
Regards,
Sumanth
- Mark as New
- Bookmark
- Subscribe
- Mute
- Subscribe to RSS Feed
- Permalink
- Report Inappropriate Content
Do you need this as a pivot table ?
You can do this in a straight table using set analysis.
- Mark as New
- Bookmark
- Subscribe
- Mute
- Subscribe to RSS Feed
- Permalink
- Report Inappropriate Content
Enable totals for the year dimension and use Dimensionality() or SecondaryDimensionality() to calculate the variance conditionally in the total column.
- Mark as New
- Bookmark
- Subscribe
- Mute
- Subscribe to RSS Feed
- Permalink
- Report Inappropriate Content
Could you attach the sample data?
- Mark as New
- Bookmark
- Subscribe
- Mute
- Subscribe to RSS Feed
- Permalink
- Report Inappropriate Content
Hi Lisa,
In a straight table would I be able to get the calculated values (as shown in the image attached earlier) in the row and the dimension in the column. When I tried to do it, straight table does not have the option to do so! Hence I used pivot table.
- Mark as New
- Bookmark
- Subscribe
- Mute
- Subscribe to RSS Feed
- Permalink
- Report Inappropriate Content
Hi Jonathan,
I am new to Qlik sense and never used Dimensionality. Can you please help me with the syntax or the process to do it?
Thanks.