Unlock a world of possibilities! Login now and discover the exclusive benefits awaiting you.
- Qlik Community
- :
- Forums
- :
- Analytics
- :
- New to Qlik Analytics
- :
- How do I make a Gantt Chart in QLik?
- Subscribe to RSS Feed
- Mark Topic as New
- Mark Topic as Read
- Float this Topic for Current User
- Bookmark
- Subscribe
- Mute
- Printer Friendly Page
- Mark as New
- Bookmark
- Subscribe
- Mute
- Subscribe to RSS Feed
- Permalink
- Report Inappropriate Content
How do I make a Gantt Chart in QLik?
Im trying to make a solid Gantt Chart but it is very hard for me. I have a starrtime a date a duration. but when I use duration without a sum it does not show me anything. But when I use sum the Gannt Chart is not correct. I have different pidcodes which are different products and I want to make a daily Gantt Chart of it. Can someone help me, if you need more information please ask for it...

Doorlooptijd :Duration
Starttijd: Starttime
Eindtijd: Endtime
At the end there is a total of products produced
- Mark as New
- Bookmark
- Subscribe
- Mute
- Subscribe to RSS Feed
- Permalink
- Report Inappropriate Content
try using Patricks work around one.
or investigate Vizlibs extension
- Mark as New
- Bookmark
- Subscribe
- Mute
- Subscribe to RSS Feed
- Permalink
- Report Inappropriate Content
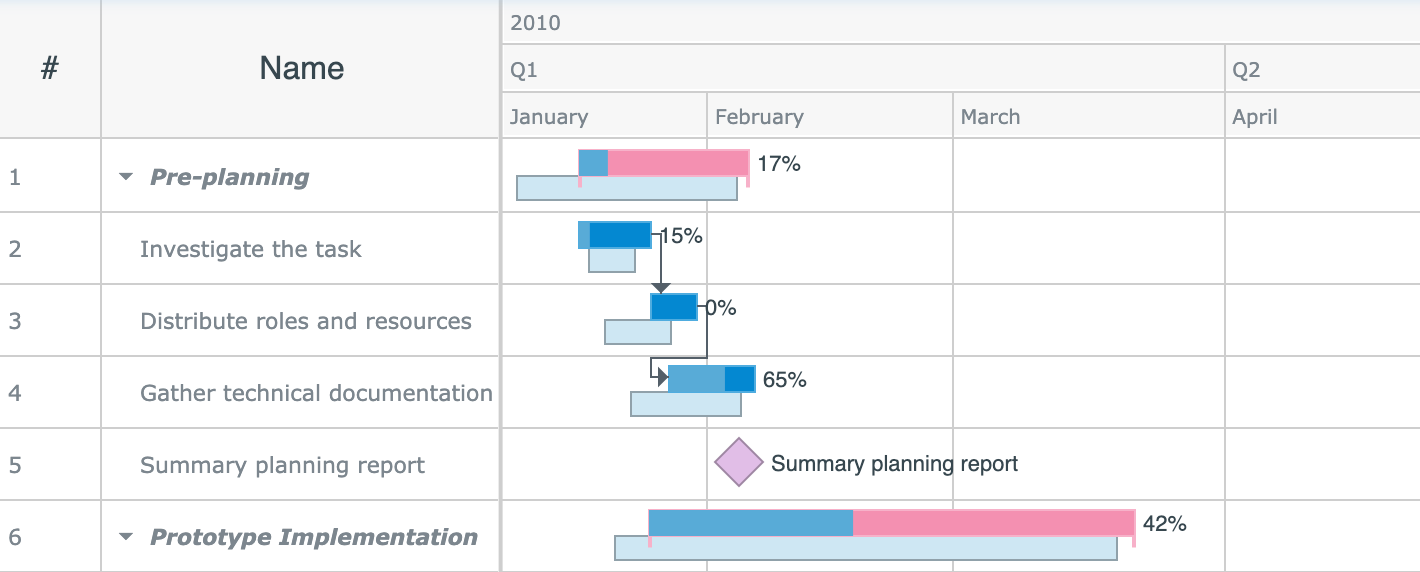
Check out AnyGantt by AnyChart:
https://qlik.anychart.com/extensions/anygantt/overview/
Watch this video tutorial:
- Mark as New
- Bookmark
- Subscribe
- Mute
- Subscribe to RSS Feed
- Permalink
- Report Inappropriate Content
Hi, here you have a video that shows you how you can achive this using a bar chart