Unlock a world of possibilities! Login now and discover the exclusive benefits awaiting you.
- Qlik Community
- :
- Forums
- :
- Analytics
- :
- New to Qlik Analytics
- :
- Re: How to adjust area plot in Bar chart in Qlikse...
- Subscribe to RSS Feed
- Mark Topic as New
- Mark Topic as Read
- Float this Topic for Current User
- Bookmark
- Subscribe
- Mute
- Printer Friendly Page
- Mark as New
- Bookmark
- Subscribe
- Mute
- Subscribe to RSS Feed
- Permalink
- Report Inappropriate Content
How to adjust area plot in Bar chart in Qliksense
Hi Folks,
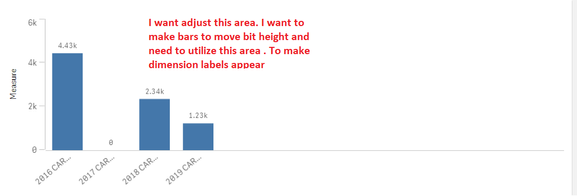
Can any one suggest me how can we adjust plot area in Bar chart. As you can see in the below mentioned screenshot
Just like in Qlikview we have option like Ctrl+Shift option to Adjust So in the same way do we have any option like that in Qliksense or any extension for this functionality Please suggest
Thanks and Regards,
Satya
- Mark as New
- Bookmark
- Subscribe
- Mute
- Subscribe to RSS Feed
- Permalink
- Report Inappropriate Content
Currently there is no out of the box functionality which allows custom sizing of the plot area. You can however change the min/max range if you wanted to, to allow for more white spacing at the top.
Thanks,
Wynand
- Mark as New
- Bookmark
- Subscribe
- Mute
- Subscribe to RSS Feed
- Permalink
- Report Inappropriate Content
Hi Wynand,
Thank you so much for your response. I unable to find Min & Max Range in my Qliksense Version. I am getting Range option only for Min but not for Max. Could you please help me with providing path for that options
Thanks and Regards,
Satya
- Mark as New
- Bookmark
- Subscribe
- Mute
- Subscribe to RSS Feed
- Permalink
- Report Inappropriate Content
Hi Satya,
When you un-select Auto Range, you have a drop-down. By selecting Min/Max, you can add values to both. Or if you wanted to only change Max, select it from the list.
Wynand
- Mark as New
- Bookmark
- Subscribe
- Mute
- Subscribe to RSS Feed
- Permalink
- Report Inappropriate Content
Thank you Wynand. Got it

