Unlock a world of possibilities! Login now and discover the exclusive benefits awaiting you.
- Qlik Community
- :
- Forums
- :
- Analytics
- :
- New to Qlik Analytics
- :
- Re: How to create Age range
- Subscribe to RSS Feed
- Mark Topic as New
- Mark Topic as Read
- Float this Topic for Current User
- Bookmark
- Subscribe
- Mute
- Printer Friendly Page
- Mark as New
- Bookmark
- Subscribe
- Mute
- Subscribe to RSS Feed
- Permalink
- Report Inappropriate Content
How to create Age range
Hi all,
I have project to analyze my member age with range.
Can you guys help me on this.
Example
| Name | Age |
| Soehoed | 14 |
| Saulina | 12 |
| Murni | 17 |
| Lina | 19 |
| Togu | 22 |
| Tan | 23 |
| Sunarti | 20 |
| Nyoman | 16 |
| Daswirman | 30 |
| Asnaria | 32 |
| Mrtha | 35 |
| Yen | 28 |
| Fatimah | 40 |
| Retno | 45 |
| Darwadi | 34 |
| Maemunah | 52 |
| Florentina | 55 |
| Andi | 65 |
| Halena | 43 |
| Susilowati | 36 |
| Elizabet | 24 |
| Isnaniek | 27 |
| Asliani | 18 |
| Darwati | 51 |
| Nurdin | 48 |
| Ambo | 41 |
| Lankoani | 36 |
I want to create range :
How many :
<17 years
17 - 25
25 - 30
30 - 40
40 - 50
> 50
Thank you
Henry
- Tags:
- age
- « Previous Replies
-
- 1
- 2
- Next Replies »
Accepted Solutions
- Mark as New
- Bookmark
- Subscribe
- Mute
- Subscribe to RSS Feed
- Permalink
- Report Inappropriate Content
Create below field in your script..
If(Age <=17, '<17 Years',
IF(Age >= 17 and Age < 25, '17 - 25',
IF(Age >= 25 and Age < 30, '25 - 30',
IF(Age >= 30 and Age < 40, '30 - 40',
IF(Age >= 40 and Age < 50, '40 - 50',
'50+'))))) as AgeRange
Now create a chart
Dimension
AgeRange
Expression
COUNT(Distinct Name)
- Mark as New
- Bookmark
- Subscribe
- Mute
- Subscribe to RSS Feed
- Permalink
- Report Inappropriate Content
If you dont want to create the same in script... use below as a calculated dimension and use the same expression provided above.
=Aggr(If(Age <=17, '<17 Years',
IF(Age >= 17 and Age < 25, '17 - 25',
IF(Age >= 25 and Age < 30, '25 - 30',
IF(Age >= 30 and Age < 40, '30 - 40',
IF(Age >= 40 and Age < 50, '40 - 50',
'50+'))))),Name)
- Mark as New
- Bookmark
- Subscribe
- Mute
- Subscribe to RSS Feed
- Permalink
- Report Inappropriate Content
Manish's solution is good. You can also uses intervalmatch(), where you load inline the ranges
For example:
Employee_age:
LOAD * INLINE [
Name, Age
John, 35
Katy, 26
William, 52
Barbara, 46
Erik, 18
];
Age:
LOAD *
INLINE [
MinAge, MaxAge
0, 17
18, 25
26, 30
31, 40
41, 50
51, 1000
];
IntervalMatch (Age)
Load
MinAge as Min_Age, /*------Rename to avoid synthetic keys---------*/
MaxAge as Max_Age
Resident
Age;
Put the appropriate fields in a straight table for e.g. :
I hope it helped!
Best,
T
- Mark as New
- Bookmark
- Subscribe
- Mute
- Subscribe to RSS Feed
- Permalink
- Report Inappropriate Content
Somehow the picture from my straight table disappeared, but I think you don't need to see it to get the point.
Best,
T
- Mark as New
- Bookmark
- Subscribe
- Mute
- Subscribe to RSS Feed
- Permalink
- Report Inappropriate Content
I think Class Function might you to achieve it..
=class(Age,5) ,it groups Age as class with difference of 5
Best Regards,
Govindaraj
- Mark as New
- Bookmark
- Subscribe
- Mute
- Subscribe to RSS Feed
- Permalink
- Report Inappropriate Content
Hi Manish,
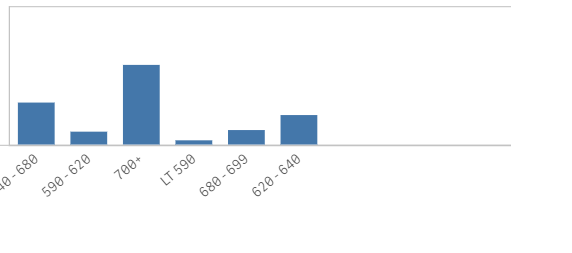
I am trying to show the range by low to high grouping, but get a scattered bars.
If(score <=590, 'LT 590',
IF(score >= 590 and score < 620, '590 - 620',
IF(score >= 620 and score < 640, '620 - 640',
IF(score >= 640 and score < 680, '640 - 680',
IF(score >= 680 and score < 699, '680 - 699',
'700+')))))
I want to start with LT590 then 590-620, etc. Any suggestions.
- Mark as New
- Bookmark
- Subscribe
- Mute
- Subscribe to RSS Feed
- Permalink
- Report Inappropriate Content
Hi, since I am new for Qlik, I feel confused about how to create field in my script. Can you give me a hint for this part? Thank you!
- Mark as New
- Bookmark
- Subscribe
- Mute
- Subscribe to RSS Feed
- Permalink
- Report Inappropriate Content
- Mark as New
- Bookmark
- Subscribe
- Mute
- Subscribe to RSS Feed
- Permalink
- Report Inappropriate Content
Y no hay una función que permita hacer eso mismo desde la expresión del gráfico?
- « Previous Replies
-
- 1
- 2
- Next Replies »