- Mark as New
- Bookmark
- Subscribe
- Mute
- Subscribe to RSS Feed
- Permalink
- Report Inappropriate Content
How to create a Pie Chart in Qlik Sense?
Hi there,
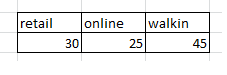
I would like to create a pie chart in qlik sense. Currently i am having such data as below, as i have column retail, online,walkin, and the amount of it.
So, question is, how can i put such data into a pie chart in qlik sense? in the pic chart, should see is divided into retail, online, walkin.

Rgds,
Jim
- « Previous Replies
-
- 1
- 2
- Next Replies »
- Mark as New
- Bookmark
- Subscribe
- Mute
- Subscribe to RSS Feed
- Permalink
- Report Inappropriate Content
Hey,
Pie chart is already embedded in Qlik sense.
Go to the app overview in the navigation drop down.
Drag the pie chart from the charts panel and add corresponding dimensions and measures to it.
I hope it helps.
Thanks
- Mark as New
- Bookmark
- Subscribe
- Mute
- Subscribe to RSS Feed
- Permalink
- Report Inappropriate Content
I know where to find the pie chart. but, can you let me know how can i create out the pie chart based on my requirement?
If i have a data as such dimension - retail, online, walkin. how can i add all of these into the pie chart and display out?
Rgds,
Jim
- Mark as New
- Bookmark
- Subscribe
- Mute
- Subscribe to RSS Feed
- Permalink
- Report Inappropriate Content
add chart and click on dimension then you can add those dimension that you need
- Mark as New
- Bookmark
- Subscribe
- Mute
- Subscribe to RSS Feed
- Permalink
- Report Inappropriate Content
If these dimensions are dependent, in that case you can create a drill down dimension and add it to your pie chart.
- Mark as New
- Bookmark
- Subscribe
- Mute
- Subscribe to RSS Feed
- Permalink
- Report Inappropriate Content
you can only add 1 dimension to your pie chart in qlik sense. In my case, there are 3 - retail, online, walkin. So,
how to add all ?
- Mark as New
- Bookmark
- Subscribe
- Mute
- Subscribe to RSS Feed
- Permalink
- Report Inappropriate Content
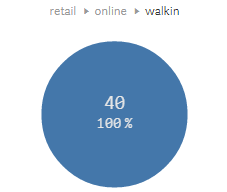
Tried to create a drill down and add it in, result was like that. still cant show it divided to retail, online, walkin in a pie chart
- Mark as New
- Bookmark
- Subscribe
- Mute
- Subscribe to RSS Feed
- Permalink
- Report Inappropriate Content
Are these related fields??
If yes then with the same chart, and see whether it takes you to further dimension..
All the records must be retail that is why it shows up 100%.
- Mark as New
- Bookmark
- Subscribe
- Mute
- Subscribe to RSS Feed
- Permalink
- Report Inappropriate Content
they are not related fileds, means cannot use drill down rite?
My data is as such
load * inline
[
retail,online,walkin
30,25,45
];
- Mark as New
- Bookmark
- Subscribe
- Mute
- Subscribe to RSS Feed
- Permalink
- Report Inappropriate Content
If your fields are not related you can not use drill down.
- « Previous Replies
-
- 1
- 2
- Next Replies »