Unlock a world of possibilities! Login now and discover the exclusive benefits awaiting you.
- Qlik Community
- :
- Forums
- :
- Analytics
- :
- New to Qlik Analytics
- :
- How to create a dashboard in Calendar Structure in...
- Subscribe to RSS Feed
- Mark Topic as New
- Mark Topic as Read
- Float this Topic for Current User
- Bookmark
- Subscribe
- Mute
- Printer Friendly Page
- Mark as New
- Bookmark
- Subscribe
- Mute
- Subscribe to RSS Feed
- Permalink
- Report Inappropriate Content
How to create a dashboard in Calendar Structure in qlik sense?
I want to create a dashboard in calendar structure using Qlik Sense as shown below.
MONTH YEAR
| SUN | MON | TUE | WED | THU | FRI | SAT |
|---|---|---|---|---|---|---|
| 1 | 2 | 3 | 4 | 5 | 6 | 7 |
| 8 | 9 | 10 | 11 | 12 | 13 | 14 |
| 15 | 16 | 17 | 18 | 19 | 20 | 21 |
| 22 | 23 | 24 | 25 | 26 | 27 | 28 |
| 29 | 30 | 31 |
Case:
I have a sales data like: OrderID, OrderItem, and OrderDate.
By selecting month and year, the dashboard needs to show the monthly calendar of that month and year as like shown above. and also on clicking a particular date from the monthly calendar, it has to take me to the another dashboard where all the order details will show for that particular date that is selected from the monthly calendar.
Also the monthly calendar needs to show the Count of the sales Order either in numeric or in color view for each date.
Is it possible? If yes then how?
- Mark as New
- Bookmark
- Subscribe
- Mute
- Subscribe to RSS Feed
- Permalink
- Report Inappropriate Content
Hi
HAve a look on QlikBranch Site and try with one of this extension :
http://branch.qlik.com/#!/project/56728f52d1e497241ae6983e
exemple :

you should adapt it with a week structure in y-axis and day of week in x-axis
Tile created support numeric value and are colored by mesure
- Mark as New
- Bookmark
- Subscribe
- Mute
- Subscribe to RSS Feed
- Permalink
- Report Inappropriate Content
Hi Bruno,
The example you showed me above is cool but what i want to do is that suppose if i am selecting a month and the year, a monthly calendar structure(i.e a grid of 7 by 5 structure) will come in the dashboard in such a way that if day 1 fall on Tuesday, then box correspond to Sunday and Monday of 1st week of that month will be empty as shown below
I want to show the days in the box. and inside that box i also wants to see the Count of the salesorder or all the order id number.
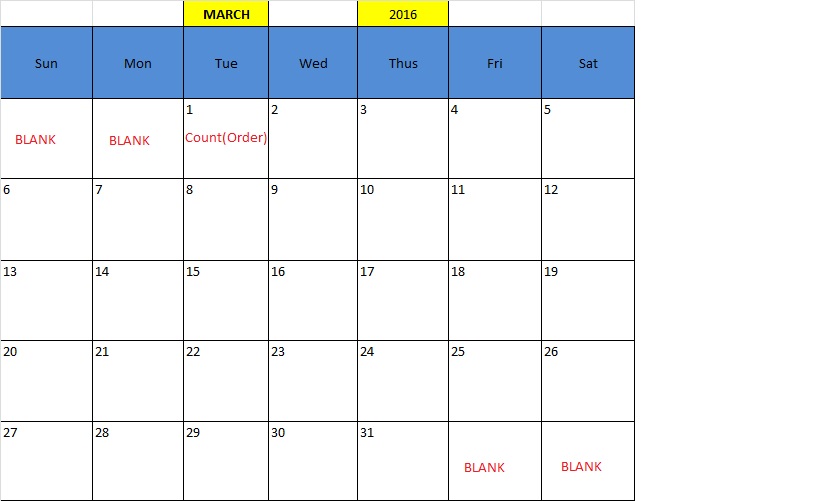
I tried with the example that you showed me above but i am getting the days on the x-axis only not in the box.
- Mark as New
- Bookmark
- Subscribe
- Mute
- Subscribe to RSS Feed
- Permalink
- Report Inappropriate Content
Hi
you should use weekday function on x axis to get sunday monday ... and week function
something like
weekday(Date) as DayofWeek, in your script
week(date) as Week
then Dim 1 = DayofWeek
Dim 2 = Week
mesure = your mesure
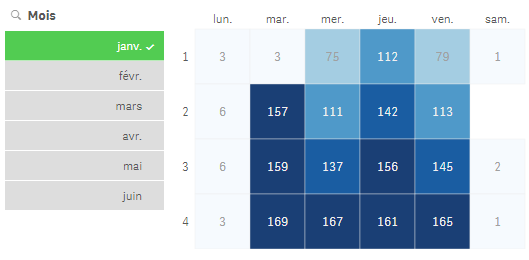
here is an example i use in one of my app :
where i have weekdays on x axis and week in y axis :
- Mark as New
- Bookmark
- Subscribe
- Mute
- Subscribe to RSS Feed
- Permalink
- Report Inappropriate Content
Hi Bruno,
Still not able to do it. And also in your above example, i don't know how to display the date at the top-left corner on each square box as i showed on my previous reply along with the measures.
- Mark as New
- Bookmark
- Subscribe
- Mute
- Subscribe to RSS Feed
- Permalink
- Report Inappropriate Content
Hi
Can you share your data in excel file so that i could easily create a sample app with your requierment ?
no need to get all the date just a sample with a least 2 ou 3 months of data
Bruno