Unlock a world of possibilities! Login now and discover the exclusive benefits awaiting you.
- Qlik Community
- :
- Forums
- :
- Analytics
- :
- New to Qlik Analytics
- :
- How to create this Line Chart?
- Subscribe to RSS Feed
- Mark Topic as New
- Mark Topic as Read
- Float this Topic for Current User
- Bookmark
- Subscribe
- Mute
- Printer Friendly Page
- Mark as New
- Bookmark
- Subscribe
- Mute
- Subscribe to RSS Feed
- Permalink
- Report Inappropriate Content
How to create this Line Chart?
Dear community,
i have a list of order dates, structured as below:
| Order No | Reference Date | Creation Date | Closing Date |
| 1 | 01/01/2021 | 01/01/2021 | 02/01/2021 |
| 2 | 02/01/2021 | 02/01/2021 | 02/01/2021 |
| 3 | 02/01/2021 | 02/01/2021 | 03/01/2021 |
| 4 | 02/01/2021 | 02/01/2021 | 05/01/2021 |
| 5 | 03/01/2021 | 03/01/2021 | 05/01/2021 |
| 6 | 03/01/2021 | 03/01/2021 | 05/01/2021 |
| 7 | 04/01/2021 | 04/01/2021 | 06/01/2021 |
| 8 | 05/01/2021 | 05/01/2021 | 06/01/2021 |
| 9 | 06/01/2021 | 06/01/2021 | 06/01/2021 |
| 10 | 06/01/2021 | 06/01/2021 | 06/01/2021 |
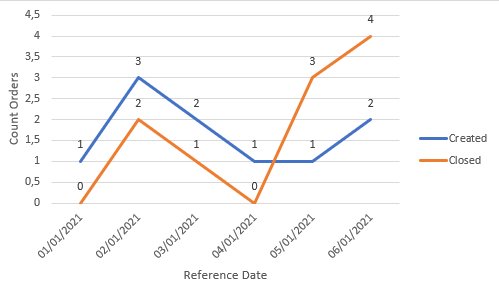
Now i need to create a line chart where i have [Reference Date] on X-axis and count the orders created and closed on that [Reference Date] on Y-axis.
In order to obtain something like this:
I would like to create this chart without adding script during load.
Can someone help me?
You can find these data in the attached file.
Thanks in advice
If a post helps to resolve your issue, please accept it as a Solution.
- Mark as New
- Bookmark
- Subscribe
- Mute
- Subscribe to RSS Feed
- Permalink
- Report Inappropriate Content
DateTable:
LOAD * Inline [
Order No, Reference Date, Creation Date, Closing Date
1, 01/01/2021, 01/01/2021, 02/01/2021
2, 02/01/2021, 02/01/2021, 02/01/2021
3, 02/01/2021, 02/01/2021, 03/01/2021
4, 02/01/2021, 02/01/2021, 05/01/2021
5, 03/01/2021, 03/01/2021, 05/01/2021
6, 03/01/2021, 03/01/2021, 05/01/2021
7, 04/01/2021, 04/01/2021, 06/01/2021
8, 05/01/2021, 05/01/2021, 06/01/2021
9, 06/01/2021, 06/01/2021, 06/01/2021
10 ,06/01/2021, 06/01/2021, 06/01/2021
];
Load "Creation Date" as "Reference Date",
'Created' as TypeDate Resident DateTable;
Load "Closing Date" as "Reference Date",
'Closed' as TypeDate Resident DateTable;
Now create a line chart as follow :
Result :
- Mark as New
- Bookmark
- Subscribe
- Mute
- Subscribe to RSS Feed
- Permalink
- Report Inappropriate Content
Dear @OmarBenSalem ,
thanks for your solution but, as i wrote in my post, i'm looking for a solution without adding script.
If a post helps to resolve your issue, please accept it as a Solution.


