Unlock a world of possibilities! Login now and discover the exclusive benefits awaiting you.
- Qlik Community
- :
- Forums
- :
- Analytics
- :
- New to Qlik Analytics
- :
- Re: How to customize two color in one line chart
- Subscribe to RSS Feed
- Mark Topic as New
- Mark Topic as Read
- Float this Topic for Current User
- Bookmark
- Subscribe
- Mute
- Printer Friendly Page
- Mark as New
- Bookmark
- Subscribe
- Mute
- Subscribe to RSS Feed
- Permalink
- Report Inappropriate Content
How to customize two color in one line chart
I want to customize two different colors for two lines in one line chart in Qlik Sense but seems it only can apply the one colors to two lines.
Could you please give some suggestions for it?
Regards\ Helen
- « Previous Replies
-
- 1
- 2
- Next Replies »
- Mark as New
- Bookmark
- Subscribe
- Mute
- Subscribe to RSS Feed
- Permalink
- Report Inappropriate Content
Hi Helen Tang,
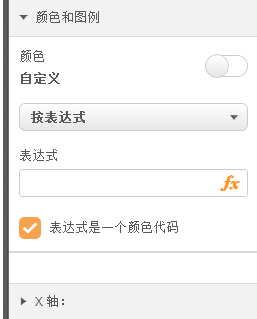
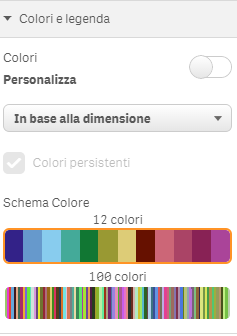
You can color the line chart the way you need. Please check the image below:.PNG)
!
- Mark as New
- Bookmark
- Subscribe
- Mute
- Subscribe to RSS Feed
- Permalink
- Report Inappropriate Content
Hi Helen Tang,
I have even attached a sample qvf in my previous reply for better understanding.
- Sangram
- Mark as New
- Bookmark
- Subscribe
- Mute
- Subscribe to RSS Feed
- Permalink
- Report Inappropriate Content
Hi! If you don't care about the colours chosen, you could select to colour the lines by dimension.
If you want choose the colours, I think you ought to give an examples of the data: probably using a correct IF statement you can do it, but I think other informations could be useful.
- Mark as New
- Bookmark
- Subscribe
- Mute
- Subscribe to RSS Feed
- Permalink
- Report Inappropriate Content
Thanks Simone.
- Mark as New
- Bookmark
- Subscribe
- Mute
- Subscribe to RSS Feed
- Permalink
- Report Inappropriate Content
Hi Sangram,
Thanks for your quick reply.
I don't know how to make line chart colors as you attached.
For my problem, I just want to complete two specific colors for the two lines .(eg.RGB(123,145,241), RGB(111,47,200))
By the way, is there any way to change the line style for the line chart?
I 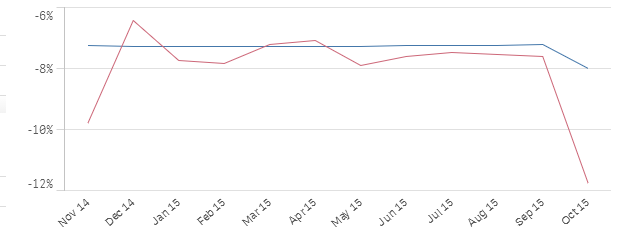
- Mark as New
- Bookmark
- Subscribe
- Mute
- Subscribe to RSS Feed
- Permalink
- Report Inappropriate Content
Hi Helen,
Refer to the link below. i have attached a sample QVF, on how to get the colouring done.
Line charts with dynamic / filterable measures
Let me know if you face any issues.
Hope this helps!
Thanks and Regards,
Sangram Reddy.
- Mark as New
- Bookmark
- Subscribe
- Mute
- Subscribe to RSS Feed
- Permalink
- Report Inappropriate Content
Hi Helen,
By the way, is there any way to change the line style for the line chart?
I dint understand this question? Could you please elaborate?
- Mark as New
- Bookmark
- Subscribe
- Mute
- Subscribe to RSS Feed
- Permalink
- Report Inappropriate Content
By the way, is there any way to change the line style for the line chart?
I
No is not
Feeling Qlikngry?
- Mark as New
- Bookmark
- Subscribe
- Mute
- Subscribe to RSS Feed
- Permalink
- Report Inappropriate Content
Hi Sangram,
What I want to know is that can we change the line style (eg. change to dash line ) for line chart in Qlik Sense.
Why I ask this is due to we can do this is Qlikview but not sure whether there is the same function for Qlik Sense.
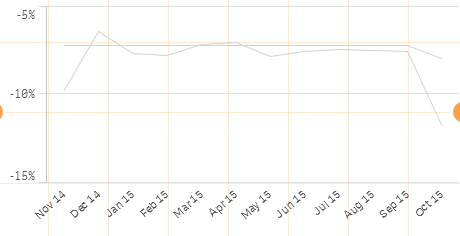
Please refer to attached picture to know what I wanna implement.
- « Previous Replies
-
- 1
- 2
- Next Replies »