Unlock a world of possibilities! Login now and discover the exclusive benefits awaiting you.
- Qlik Community
- :
- Forums
- :
- Analytics
- :
- New to Qlik Analytics
- :
- Re: How to get the correct value with average func...
- Subscribe to RSS Feed
- Mark Topic as New
- Mark Topic as Read
- Float this Topic for Current User
- Bookmark
- Subscribe
- Mute
- Printer Friendly Page
- Mark as New
- Bookmark
- Subscribe
- Mute
- Subscribe to RSS Feed
- Permalink
- Report Inappropriate Content
How to get the correct value with average function?
Hi everbody,
I have a problem with function Avg(), due to I can´t get the real value when I try to use it.
I have a table in excel like this:
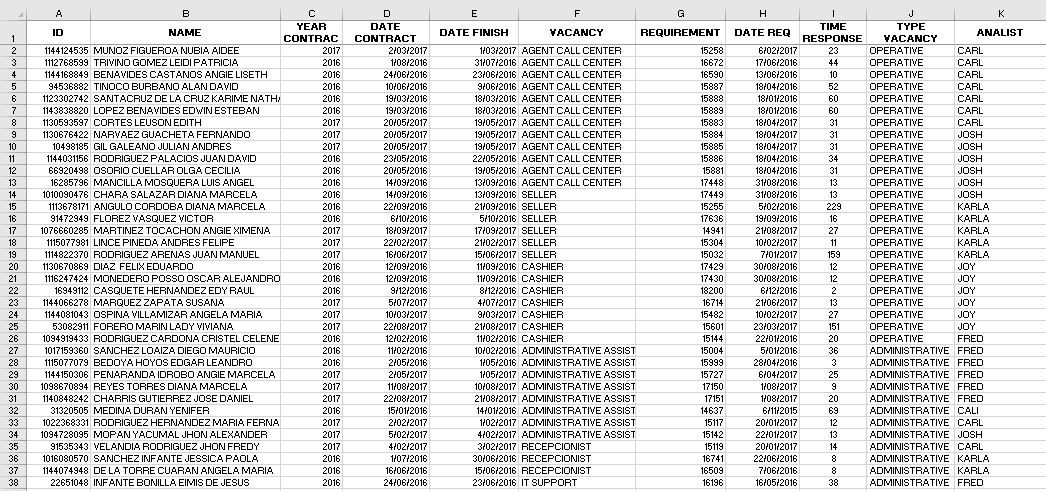
I need to calculate the average time for each vacancy and display it for each Analist. In excel, I can get the table with these data (I use formule of course) and obtain the exactly values, but when I try to do in Qlik, the average isn't correct.
I obtain the time response like this: DATE FINISH - DATE REQ. If I want to get the time average in Qlik, I just select the pivot table with this data:
Dimension: Year, Vacancy
Measure: Avg([TIME RESPONSE])
My pivot table looks like this:
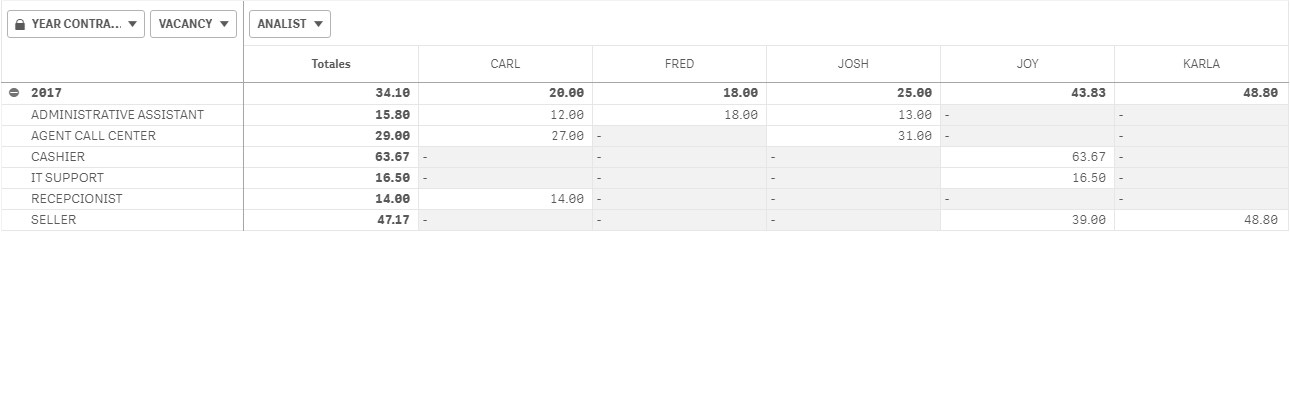
Here's the problem...the results in Qlik are very different when I use Average function
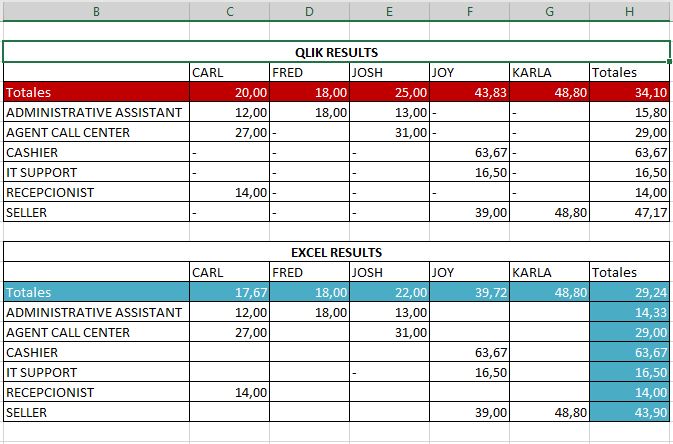
So, I don't know how obtain the same results in both Qlik and Excel.
Who can help me?!!
P.D. Sorry if my english have some mistakes...
- Mark as New
- Bookmark
- Subscribe
- Mute
- Subscribe to RSS Feed
- Permalink
- Report Inappropriate Content
Try this:
Avg(Aggr(Avg([TIME RESPONSE]), Year, Vacancy, Analist))
- Mark as New
- Bookmark
- Subscribe
- Mute
- Subscribe to RSS Feed
- Permalink
- Report Inappropriate Content
Hi, that expression works for my example...but how could apply that concept in my excel file (attach) -it's in spanish but the idea is the same-. I want to provide this example:
| Vacancy | Time Response | Month | Analist |
|---|---|---|---|
| Seller | 30 | Jan | Carl |
| Seller | 52 | Jan | Carl |
| Seller | 15 | Jan | Carl |
| Seller | 40 | Jan | Fred |
| Seller | 22 | Jan | Fred |
| Seller | 12 | Feb | Carl |
| Seller | 10 | Feb | Fred |
| Seller | 30 | Feb | Fred |
Average time response for January / Seller / Carl: 32,33
Average time response for January / Seller / Fred: 31,00
Average time response for January / Seller : average(32,33;31) -->31,66
Average time response for Febrary/ Seller / Carl: 12
Average time response for Febrary/ Seller / Fred: 20
Average time response for Febrary / Seller : average(12;20) -->16
If I want to create an average for Jan-Feb in a excel, the table looks like this
| Carl | Fred | Time Response Average | |
| Seller | =average(Jan;Feb) | =average(Jan;Feb) | =average(Carl_Seller; Fred_Seller) |
| Carl | Fred | Time Response Average | |
| Seller | 22,16 | 25,5 | 23,83 |
So, when I try to reply this calculation in Qlik Sense (I use your expression), the result it's different to my file (attach)
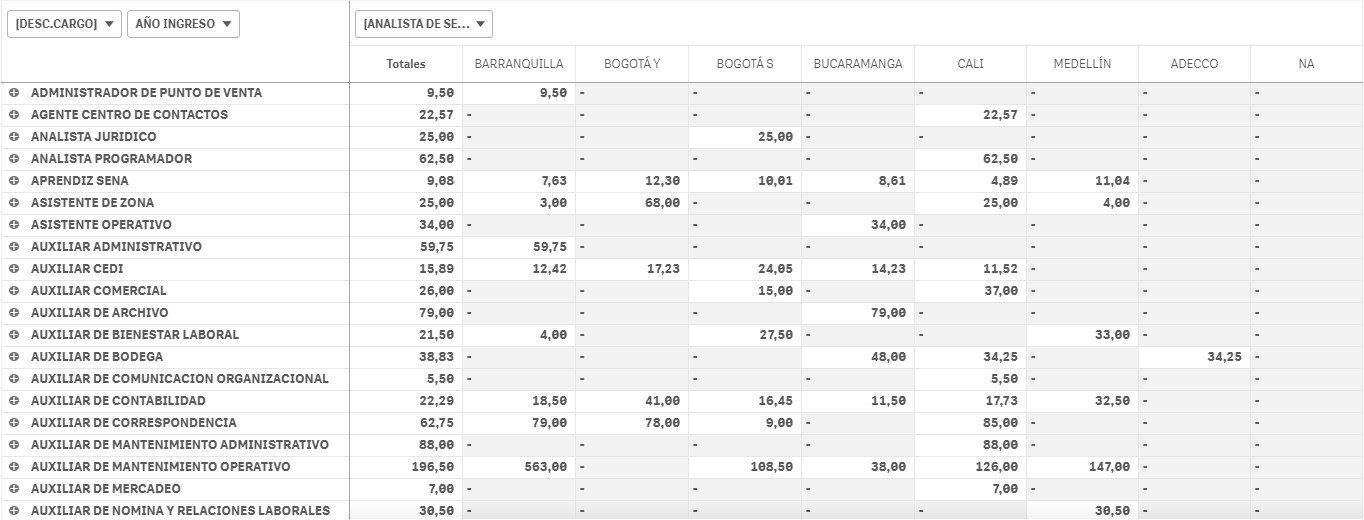
I need to do this for compare 2 years (2016-2017) per Analist per Vacancy (like pivot table). Maybe I have been doing something wrong, but I can't found it.
I hope that my question can be solution.
Thanks.
- Mark as New
- Bookmark
- Subscribe
- Mute
- Subscribe to RSS Feed
- Permalink
- Report Inappropriate Content
Hi,
about my problem or question, is it possible to do it?
In case not, please close this threat.
Thank you.