Unlock a world of possibilities! Login now and discover the exclusive benefits awaiting you.
- Qlik Community
- :
- Forums
- :
- Analytics
- :
- New to Qlik Analytics
- :
- How to hide 0 value in Qlik sense when using Set A...
- Subscribe to RSS Feed
- Mark Topic as New
- Mark Topic as Read
- Float this Topic for Current User
- Bookmark
- Subscribe
- Mute
- Printer Friendly Page
- Mark as New
- Bookmark
- Subscribe
- Mute
- Subscribe to RSS Feed
- Permalink
- Report Inappropriate Content
How to hide 0 value in Qlik sense when using Set Analysis?
My table has two columns: myDate and myNumber.
I use myDate as dimension and myNumber as measure, and try to plot accumulation of myNumber.
I use the following Set Analysis to show default of myNumber on chart (bigger than 20) if I do not select a date range.
If(GetSelectedCount(myDate),
RangeSum ( above ( Sum(myNumber) , 0 , RowNo() ) ) ,
RangeSum ( above ( Sum({$< myNumber *= {">=20" } >} myNumber) , 0 , RowNo() ) )
)
I also uncheck 'Show zero value' at Qlik sense.
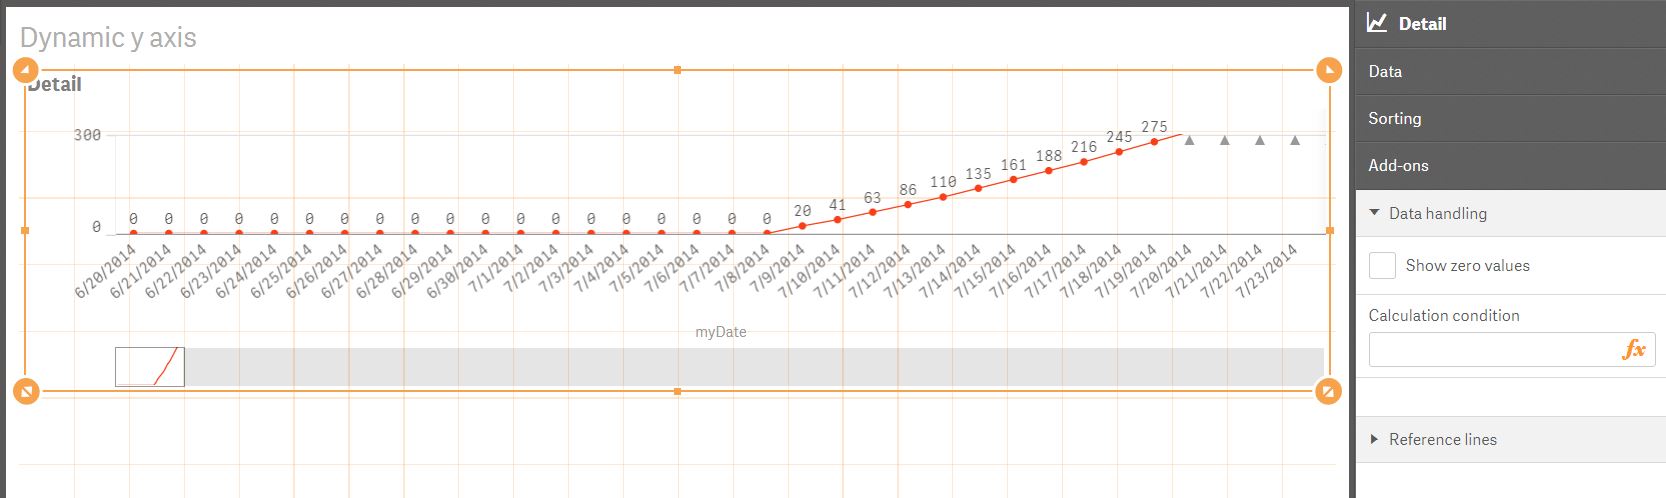
However, there is still 0 value on the chart?
Any suggestion is appreciated!
Accepted Solutions
- Mark as New
- Bookmark
- Subscribe
- Mute
- Subscribe to RSS Feed
- Permalink
- Report Inappropriate Content
When I open your qvf file I see this:

I am not seeing leading zero line chart. The reason could be that you are using an older version of Qlik Sense. I am using Qlik Sense 3.0. I think once you update to the recent version, you should be good to go 
- Mark as New
- Bookmark
- Subscribe
- Mute
- Subscribe to RSS Feed
- Permalink
- Report Inappropriate Content
Are you able to post the sample app. You don't want to show 0, but do you still want to show those dates with no value or don't show those dates as well?
- Mark as New
- Bookmark
- Subscribe
- Mute
- Subscribe to RSS Feed
- Permalink
- Report Inappropriate Content
Nhu, thanks for your help!
Please check the attached app.
I do not want to show 0; I do not want to show those dates with no value either.
Any suggestion is appreciated!
- Mark as New
- Bookmark
- Subscribe
- Mute
- Subscribe to RSS Feed
- Permalink
- Report Inappropriate Content
When I open your qvf file I see this:
I am not seeing leading zero line chart. The reason could be that you are using an older version of Qlik Sense. I am using Qlik Sense 3.0. I think once you update to the recent version, you should be good to go
- Mark as New
- Bookmark
- Subscribe
- Mute
- Subscribe to RSS Feed
- Permalink
- Report Inappropriate Content
Me too , I'm on v3 so i see the same as what Sunny sent
- Mark as New
- Bookmark
- Subscribe
- Mute
- Subscribe to RSS Feed
- Permalink
- Report Inappropriate Content
Nhu and Sunny , thanks so much for your help!
I tried Qlik sense 3.0 and get the same plot without 0 value on the chart as you suggested.