Unlock a world of possibilities! Login now and discover the exclusive benefits awaiting you.
- Qlik Community
- :
- Forums
- :
- Analytics
- :
- New to Qlik Analytics
- :
- How to keep a column value always on top in a tabl...
- Subscribe to RSS Feed
- Mark Topic as New
- Mark Topic as Read
- Float this Topic for Current User
- Bookmark
- Subscribe
- Mute
- Printer Friendly Page
- Mark as New
- Bookmark
- Subscribe
- Mute
- Subscribe to RSS Feed
- Permalink
- Report Inappropriate Content
How to keep a column value always on top in a table chart ?
Hi ,
I have a table chart with 5 columns . One of the column name is Company Name which consists of values like
A,B,C,D,Others as top 5 values based on Sum(Sales) Rankings.
Now I want A to be always on top even if the filter values change and the ranking based on sum(Sales) shows otherwise.
e.g. If Year = 2022, Sum(Sales) column has A as top company. But in Year = 2021, Sum(Sales) shows B as Top company. So, how can I show A as top company and then other Ranking based on Sum(Sales).
Please let me know if there is any way to achieve this.
- Mark as New
- Bookmark
- Subscribe
- Mute
- Subscribe to RSS Feed
- Permalink
- Report Inappropriate Content
Create custom sorting expression
Under Sorting >> CHoose the dimension >> Enable Custom >> Sort by Expression
=Wildmatch(Fieldname,'value2','value1','Y',''Z')
add fieldvalues to the wildmatch function in the order you need them sorted
OR
create a custom sort order during data load
example
Load * inline [
Dim,Val
A,23
B,23
X,32
Z,234
P,234];
;
load * inline [
Dim,so_Dim
P,1
B,2
Z,3
X,4
A,5];
exit Script;
same steps
Under Sorting >> CHoose the dimension >> Enable Custom >> Sort by Expression
now add expression = Max({1}so_Dim)
If a post helps to resolve your issue, please accept it as a Solution.
- Mark as New
- Bookmark
- Subscribe
- Mute
- Subscribe to RSS Feed
- Permalink
- Report Inappropriate Content
Hi Vineeth,
Thank you so much for your valuable input. However, I would request you to look at it again.
Even if the required value will be on top, it will not follow the ranking after that.
e.g. In my case the sorting is based on Sum(Sales) ,i.e., Sales is on Top of the sorting. I can't manually add the values of the Sales because they keep on changing based on Year filter. Say, in Year 2022, Sales for A Brand was 80 but in the Year 2021, Sales for A is 60. Same goes for other values as well.
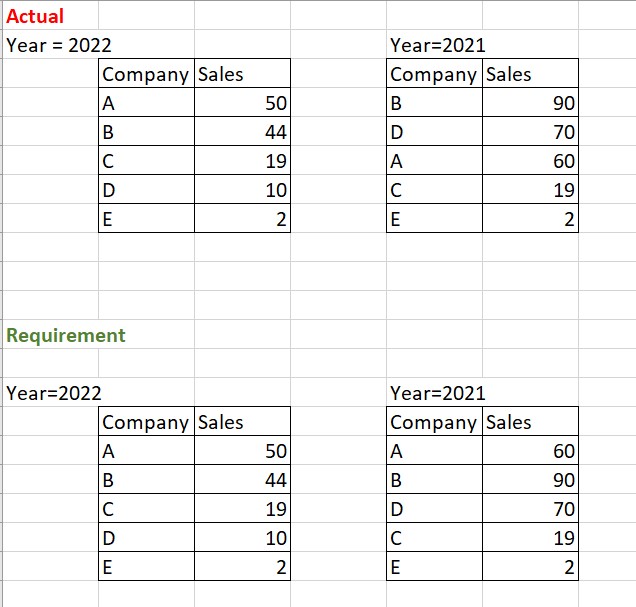
The requirement is to keep the Brand A always on top of table chart and then show the subsequent Brands based on their Rankings in descending order even if I apply Year filter or any other filter.
Please refer the screenshot attached.