Unlock a world of possibilities! Login now and discover the exclusive benefits awaiting you.
- Qlik Community
- :
- Forums
- :
- Analytics
- :
- New to Qlik Analytics
- :
- Re: How to make a selective SUM for a chart
- Subscribe to RSS Feed
- Mark Topic as New
- Mark Topic as Read
- Float this Topic for Current User
- Bookmark
- Subscribe
- Mute
- Printer Friendly Page
- Mark as New
- Bookmark
- Subscribe
- Mute
- Subscribe to RSS Feed
- Permalink
- Report Inappropriate Content
How to make a selective SUM for a chart
Hello everyone!
I´ll be probably making a very basic and silly question, but Im new ![]()
I have a table similar to this:
 14.24.43.png)
I want to make a pie chart to show how much dollars are per broker in a specific month.
In dimension I set the broker
In measure, if I use sum(value) it sums all the values, giving me always the following:
Broker A: 62
Broker B: 51
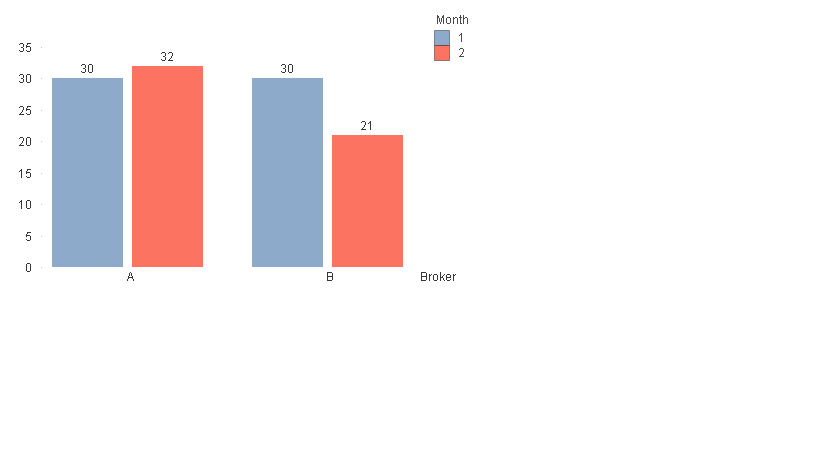
My expected result would be that if I create a chart for month 1 get the following values in the chart:
Broker A: 30
Broker B: 30
How do I make some kind of conditional SUM? (sum only when month equals 1) or there is another way?
THANK YOU SO MUCH IN ADVANCE!
PS: Im using qlik sense cloud
Accepted Solutions
- Mark as New
- Bookmark
- Subscribe
- Mute
- Subscribe to RSS Feed
- Permalink
- Report Inappropriate Content
Use set analysis to filter month specific records -
Sum({<Month={1}>}Value)
- Mark as New
- Bookmark
- Subscribe
- Mute
- Subscribe to RSS Feed
- Permalink
- Report Inappropriate Content
Use set analysis to filter month specific records -
Sum({<Month={1}>}Value)
- Mark as New
- Bookmark
- Subscribe
- Mute
- Subscribe to RSS Feed
- Permalink
- Report Inappropriate Content
once you will select Month pi will change to you are looking for
but if you want to have a static chart
for ever month
like Digvijay
Sum({1<Month={1}>}Value)
Sum({1<Month={2}>}Value)
- Mark as New
- Bookmark
- Subscribe
- Mute
- Subscribe to RSS Feed
- Permalink
- Report Inappropriate Content
THANK you Jahanzeb & Digvijay very helpful!
- Mark as New
- Bookmark
- Subscribe
- Mute
- Subscribe to RSS Feed
- Permalink
- Report Inappropriate Content

- Mark as New
- Bookmark
- Subscribe
- Mute
- Subscribe to RSS Feed
- Permalink
- Report Inappropriate Content
May be it will help ,try with this
- Mark as New
- Bookmark
- Subscribe
- Mute
- Subscribe to RSS Feed
- Permalink
- Report Inappropriate Content
Great! Please close the thread by marking correct and helpful answers.
- Mark as New
- Bookmark
- Subscribe
- Mute
- Subscribe to RSS Feed
- Permalink
- Report Inappropriate Content
Thank you everyone! I didn´t expectedsuch a fast reply and quality answers!
Three options worked in the very same way:
Sum({<Month={1}>}Value)
Sum({1<Month={1}>}Value)
Sum({$<Month={1}>}Value)
But I dont understand the differences among those three ![]()
Clarification would be very apprecitaed, thanks!
- Mark as New
- Bookmark
- Subscribe
- Mute
- Subscribe to RSS Feed
- Permalink
- Report Inappropriate Content
First and Last is same if there is no $ qlik counts it $ which tells that selection should be count in.
1 tels that selection should not be considered