Unlock a world of possibilities! Login now and discover the exclusive benefits awaiting you.
- Qlik Community
- :
- Forums
- :
- Analytics & AI
- :
- Products & Topics
- :
- Visualization and Usability
- :
- How to put a line chart in qlik sense without scro...
- Subscribe to RSS Feed
- Mark Topic as New
- Mark Topic as Read
- Float this Topic for Current User
- Bookmark
- Subscribe
- Mute
- Printer Friendly Page
- Mark as New
- Bookmark
- Subscribe
- Mute
- Subscribe to RSS Feed
- Permalink
- Report Inappropriate Content
How to put a line chart in qlik sense without scroll..?
Hi..How to put a line chart in qlik sense without scroll option since I want to show a trend wise performance a scroll within a chart is meaning less.Is there any option to restrict a scroll options in qlik sense..?
- « Previous Replies
-
- 1
- 2
- Next Replies »
- Mark as New
- Bookmark
- Subscribe
- Mute
- Subscribe to RSS Feed
- Permalink
- Report Inappropriate Content
Hi Sathiya - I assume you mean without the scrolling "Preview Window" on the bottom?
Currently there isn't anyway to turn that off. It has been entered as a feature enhancement.
Please let us know, if I am mistaken in my assumption.
Please mark the appropriate replies as helpful / correct so our team and other members know that your question(s) has been answered to your satisfaction.
Regards,
Mike T
Qlik
Mike Tarallo
Qlik
- Mark as New
- Bookmark
- Subscribe
- Mute
- Subscribe to RSS Feed
- Permalink
- Report Inappropriate Content

Thanks Michael,
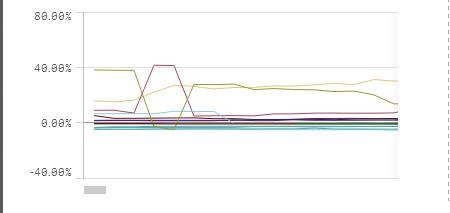
I mentioned the above scroll option in a line chart which I don't want to show to my users when I reduce a size of the chart this scroll appears at a bottom.
- Mark as New
- Bookmark
- Subscribe
- Mute
- Subscribe to RSS Feed
- Permalink
- Report Inappropriate Content
Hi Sathiya -
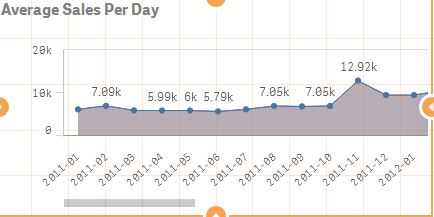
I tried this with Qlik Sense Server version 1.0.1 - and used FireFox and the responsive design mode - Ctrl + Shift + M and I am not seeing this behavior.
The chart does auto-resize and configure itself to either allow the preview window to display - but I do not see this small scroll bar.

See the attached video at the bottom of this post.
Can you give me a bit more information about your environment?
- What version and edition of Qlik Sense? - Desktop / Server - I assume Server
- What browser?
- Any repro steps - that you perform - when you see this scrollbar
- Updated screenshots or even video snippet of what you are seeing.
Mike Tarallo
Qlik
- Mark as New
- Bookmark
- Subscribe
- Mute
- Subscribe to RSS Feed
- Permalink
- Report Inappropriate Content
Hi Michael,
The above chart you are shown is using a single dimension but my requirement is to use double dimension in a line chart.I have tried same chart using double dimension it is showing same scroll bar.

- Mark as New
- Bookmark
- Subscribe
- Mute
- Subscribe to RSS Feed
- Permalink
- Report Inappropriate Content
I see this now - I can reproduce with the second metric added to the line chart. - I will report this to R&D and see what they say. However - the bar only appears when there is more data to be seen via scrolling. Why would you want to limit that functionality?


Mike
Mike Tarallo
Qlik
- Mark as New
- Bookmark
- Subscribe
- Mute
- Subscribe to RSS Feed
- Permalink
- Report Inappropriate Content
Hi Michael,
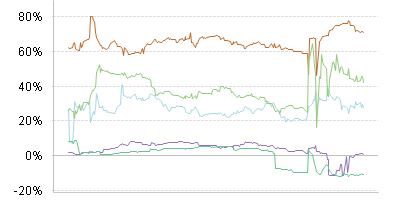
As we are showing inception to date information in the chart dimension.Users want to see a latest date and old dates in the same window not using scroll.
For example like this...

- Mark as New
- Bookmark
- Subscribe
- Mute
- Subscribe to RSS Feed
- Permalink
- Report Inappropriate Content
Ah I see - ok - so that functionality would be attributed to what is similiar to a micro-chart. I will inform R&D. Thanks for your question and additional detail. It is very helpful when improving the product.
Regards,
Mike
Mike Tarallo
Qlik
- Mark as New
- Bookmark
- Subscribe
- Mute
- Subscribe to RSS Feed
- Permalink
- Report Inappropriate Content
Thanks Michael for your valuable response.
- Mark as New
- Bookmark
- Subscribe
- Mute
- Subscribe to RSS Feed
- Permalink
- Report Inappropriate Content
Like i said before we need the continous x-Axis switch like in Qv11 for this functionality
this is at the moment not in the product. Or we need an extension for this kind of line graphs.
- « Previous Replies
-
- 1
- 2
- Next Replies »