Unlock a world of possibilities! Login now and discover the exclusive benefits awaiting you.
- Qlik Community
- :
- Forums
- :
- Analytics
- :
- New to Qlik Analytics
- :
- Re: How to remove cross marks on map in qliksense?
- Subscribe to RSS Feed
- Mark Topic as New
- Mark Topic as Read
- Float this Topic for Current User
- Bookmark
- Subscribe
- Mute
- Printer Friendly Page
- Mark as New
- Bookmark
- Subscribe
- Mute
- Subscribe to RSS Feed
- Permalink
- Report Inappropriate Content
How to remove cross marks on map in qliksense?
Hi ,
my issue is i want show loads >30 and month(today()) .point layer=destinations
measure=if(month(today()),if(count(loads)>30,count(loads),''))
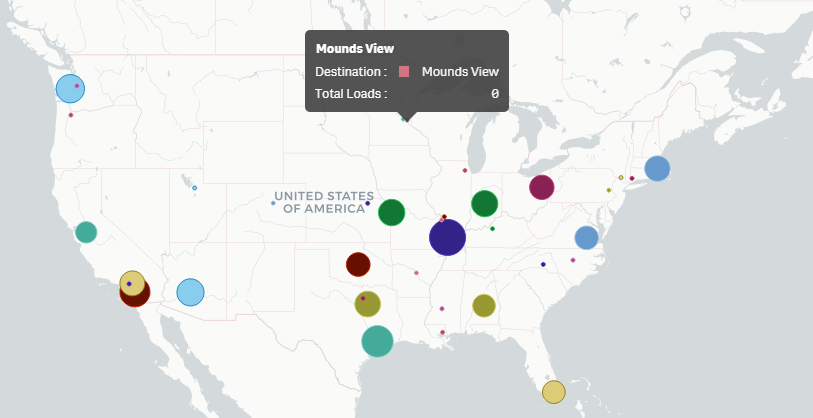
the problem is with destinations . The destination having loads greater than 30 is coming in cricle but reminig destination coming in cross mark .the destination are not filtering according to measure how to handle this issue
thanksyou
krishna
Accepted Solutions
- Mark as New
- Bookmark
- Subscribe
- Mute
- Subscribe to RSS Feed
- Permalink
- Report Inappropriate Content
Because, The cross marks are getting values as Null values? Can u define like below
=Sum(Aggr(if(month(today()),if(count(loads)>30,count(loads),'')), YourDim))
- Mark as New
- Bookmark
- Subscribe
- Mute
- Subscribe to RSS Feed
- Permalink
- Report Inappropriate Content
Could you please provide a screenshot for this ?
- Mark as New
- Bookmark
- Subscribe
- Mute
- Subscribe to RSS Feed
- Permalink
- Report Inappropriate Content
- Mark as New
- Bookmark
- Subscribe
- Mute
- Subscribe to RSS Feed
- Permalink
- Report Inappropriate Content
Any sample data ?
- Mark as New
- Bookmark
- Subscribe
- Mute
- Subscribe to RSS Feed
- Permalink
- Report Inappropriate Content
Because, The cross marks are getting values as Null values? Can u define like below
=Sum(Aggr(if(month(today()),if(count(loads)>30,count(loads),'')), YourDim))
- Mark as New
- Bookmark
- Subscribe
- Mute
- Subscribe to RSS Feed
- Permalink
- Report Inappropriate Content
Hi Anil Babu,
Thank u for your reply ,But Now it is coming Small circle.

It should show only loads>30 .
i used :Sum(Aggr(if(month(today()),if(count(loads)>30,count(loads),'')), destination)).
pls correct me if i am worng.@Anil Babu
Thanking You
Krishna
- Mark as New
- Bookmark
- Subscribe
- Mute
- Subscribe to RSS Feed
- Permalink
- Report Inappropriate Content
- Mark as New
- Bookmark
- Subscribe
- Mute
- Subscribe to RSS Feed
- Permalink
- Report Inappropriate Content
Hi Anil,
I have seen your solved resolution and have tried to apply to my similar situation but cannot remove the cross from the Map where there is a null value.
I also need to remove the cross from the point layer.
I am using the following show null values unticked.
=Aggr(if(count([Facility Standard])>0, City),[Facility Standard],City)
Please can you help in how to make this dimension not show the cross on the map
Thanks in advance for your assistance,
Daniel
