Unlock a world of possibilities! Login now and discover the exclusive benefits awaiting you.
- Qlik Community
- :
- Forums
- :
- Analytics
- :
- New to Qlik Analytics
- :
- Re: How to set sum of a column as the value of a c...
- Subscribe to RSS Feed
- Mark Topic as New
- Mark Topic as Read
- Float this Topic for Current User
- Bookmark
- Subscribe
- Mute
- Printer Friendly Page
- Mark as New
- Bookmark
- Subscribe
- Mute
- Subscribe to RSS Feed
- Permalink
- Report Inappropriate Content
How to set sum of a column as the value of a column
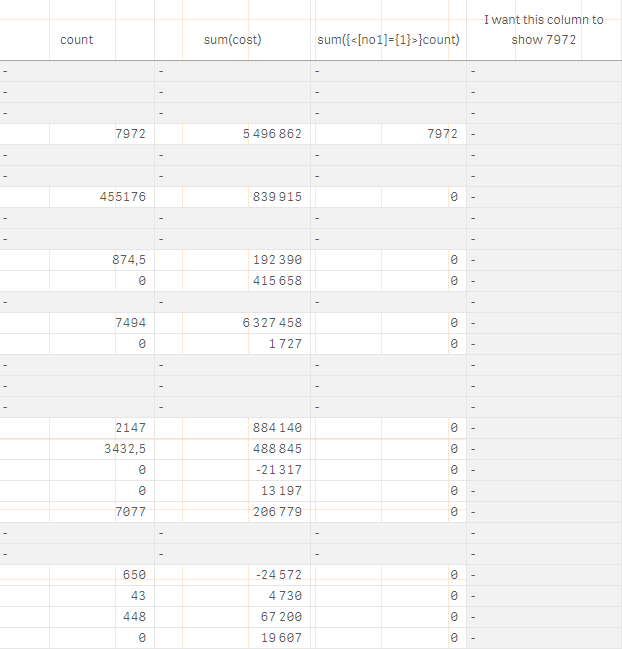
I am making a pivottable. I have diffrent types of articles as rows. Som of the articles are specially marked in [no1] as 1.
I have made a column that shows how many of my special products i have sold. Now - i want to make a column that shows total of sold special products - regardless of product number. In the example below, that column will show 7072 in each single cell.
Is that possible? I have tried a litte bit of stacked aggregation, but with no luck so far.
Please help me!

- « Previous Replies
-
- 1
- 2
- Next Replies »
- Mark as New
- Bookmark
- Subscribe
- Mute
- Subscribe to RSS Feed
- Permalink
- Report Inappropriate Content
Hello Felix,
put this expresion Aggr(sum( {<[no1]={1}>} count),Group) as Dimension to your table.
Group is dummy diminension define in the script, which aggr all of records to one group:
Load
*,
'All' as Group
From ABC
My test table:
If you have .qvf of my example, please let me know.
BR,
Petr
- Mark as New
- Bookmark
- Subscribe
- Mute
- Subscribe to RSS Feed
- Permalink
- Report Inappropriate Content
Hi Felix,
Can you append QVF with a piece of your data?
Regards,
Andrey
- Mark as New
- Bookmark
- Subscribe
- Mute
- Subscribe to RSS Feed
- Permalink
- Report Inappropriate Content
Thank you so much for your time!
Unfortunatly, i dont get it yet.
I dont really understand how the i add the piece of code as dimension. Am I supposed to add it in data import?
Please, see attached .qvf.
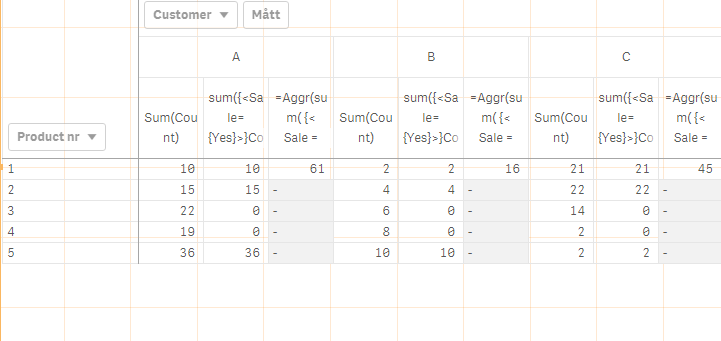
I want the measure Aggr(sum({Sale={Yes}>}Count),Group) to show 61 for A, 16 for B and 25 for C, in the whole columns.
- Mark as New
- Bookmark
- Subscribe
- Mute
- Subscribe to RSS Feed
- Permalink
- Report Inappropriate Content
Thank you so much! I have added a .qvf in the post above.
- Mark as New
- Bookmark
- Subscribe
- Mute
- Subscribe to RSS Feed
- Permalink
- Report Inappropriate Content
Anyone?
- Mark as New
- Bookmark
- Subscribe
- Mute
- Subscribe to RSS Feed
- Permalink
- Report Inappropriate Content
Sorry for delay.
What about this solution?
Put following expresion as column:
Aggr(sum( {< Sale = {'Yes'} >} Count),Customer)
P
- Mark as New
- Bookmark
- Subscribe
- Mute
- Subscribe to RSS Feed
- Permalink
- Report Inappropriate Content
Add Qvf.Přílohy
- Mark as New
- Bookmark
- Subscribe
- Mute
- Subscribe to RSS Feed
- Permalink
- Report Inappropriate Content
Assuming the value 1 or 0 in [no1]:
Sum({<[no1] = {1}>} [no1])
- Mark as New
- Bookmark
- Subscribe
- Mute
- Subscribe to RSS Feed
- Permalink
- Report Inappropriate Content
Thank you so much for your help.
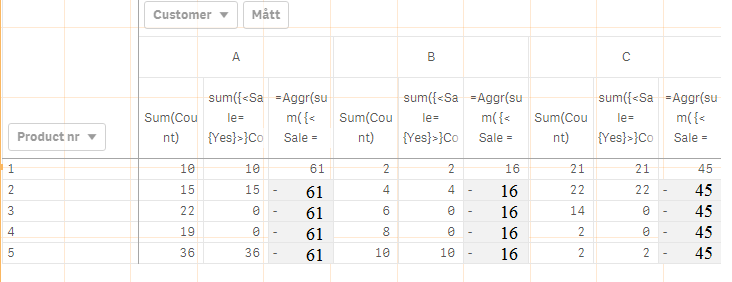
If i move our new formula to be used as a measure, i will get this result. 
Are there any way for me to get this result?

I want to relate number of sold products of a specific product to the total number of products sold on sale.
- « Previous Replies
-
- 1
- 2
- Next Replies »