Unlock a world of possibilities! Login now and discover the exclusive benefits awaiting you.
- Qlik Community
- :
- Forums
- :
- Analytics
- :
- New to Qlik Analytics
- :
- Re: How to show the last 3 months of data on a bar...
- Subscribe to RSS Feed
- Mark Topic as New
- Mark Topic as Read
- Float this Topic for Current User
- Bookmark
- Subscribe
- Mute
- Printer Friendly Page
- Mark as New
- Bookmark
- Subscribe
- Mute
- Subscribe to RSS Feed
- Permalink
- Report Inappropriate Content
How to show the last 3 months of data on a bar chart
I created the measure : Sum(Aggr(Count(DISTINCT {<KPI_DESC = {'Data Accuracy'}>} Routine), DR_GID, Country))
I am trying to show the last 3 months of the measure above on a bar chart when selecting a specific month (example: Select June 2017 and display April, May & June 2017 data). I also need to be able to further filter that data on other filters .
my data bases is :
DR_TIME_KEY | DR_YEAR | DR_QUARTER | DR_MONTH | DR_GID | KPI_DESC | Country |
| 20171130 | 2017 | 4 | 11 | 2007654 | Data Accuracy | Denmark |
| 20171030 | 2017 | 4 | 10 | 1954984 | Data Accuracy | Denmark |
| 20171230 | 2017 | 4 | 12 | 193777 | Data Accuracy | Switzerland |
| 20170830 | 2017 | 3 | 8 | 194265 | Data Accuracy | Switzerland |
| 20170730 | 2017 | 2 | 7 | 883289 | Data Accuracy | Switzerland |
| 20170630 | 2017 | 2 | 6 | 1952569 | Data Accuracy | United States |
| 20171130 | 2017 | 4 | 11 | 193894 | Data Consistency | Switzerland |
| 20171130 | 2017 | 4 | 11 | 914884 | Data Consistency | Switzerland |
| 20171130 | 2017 | 4 | 11 | 1954527 | Data Accuracy | United States |
| 20171130 | 2017 | 4 | 11 | 887302 | Data Accuracy | Switzerland |
| 20171130 | 2017 | 4 | 11 | 194285 | Data Consistency | Switzerland |
| 20171130 | 2017 | 4 | 11 | 914902 | Data Consistency | Switzerland |
I want to know what is supposed to be the new measure and the chart dimensions
if I want to choose every time different year/month and present the last 3 months which field I need to choose as a filter?
Any help would be appreciated
- Mark as New
- Bookmark
- Subscribe
- Mute
- Subscribe to RSS Feed
- Permalink
- Report Inappropriate Content
try
Sum(Aggr(Count(DISTINCT {<KPI_DESC = {'Data Accuracy'}, DR_MONTH={">= $(=max(DR_MONTH)-3) <=$(=max(DR_MONTH))"} >} Routine), DR_GID, Country))
or
make sure ur DR_TIME_KEY field is a date; change it in ur script as follow:
date(date#(DR_TIME_KEY ,'YYYYMMDD')) as DR_TIME_KEY
then:
Sum(Aggr(Count(DISTINCT {<KPI_DESC = {'Data Accuracy'},
DR_TIME_KEY={">= $(=AddMonths(max(DR_TIME_KEY)),-3)) <= $(=max(DR_TIME_KEY))"} >} Routine), DR_GID, Country))
- Mark as New
- Bookmark
- Subscribe
- Mute
- Subscribe to RSS Feed
- Permalink
- Report Inappropriate Content
I would use set analysis on the date field to restrict the chart to show the 3 latest months
In your sample, how do you create your DR_TIME_KEY field? Is this created in the script or brought it directly from data base? Is this a date field or a number field?
- Mark as New
- Bookmark
- Subscribe
- Mute
- Subscribe to RSS Feed
- Permalink
- Report Inappropriate Content
Hi Sunny,
I've tried Omar solution but it still doesn't work.
the DR_TIME_KEY field is brought it directly from data base, I think it is a dta field brcausr the Qlik created manually Year, Month etc' for this field. ( I attached screenshot)
hope you can help me with my question.
- Mark as New
- Bookmark
- Subscribe
- Mute
- Subscribe to RSS Feed
- Permalink
- Report Inappropriate Content
Can you tried his modified suggestion (after or)
- Mark as New
- Bookmark
- Subscribe
- Mute
- Subscribe to RSS Feed
- Permalink
- Report Inappropriate Content
Hi,
I've tried his suggestion but it doesn't work. I got 0 as a results per each month.
I attached the QVF maybe I did something wrong.
- Mark as New
- Bookmark
- Subscribe
- Mute
- Subscribe to RSS Feed
- Permalink
- Report Inappropriate Content
Try this
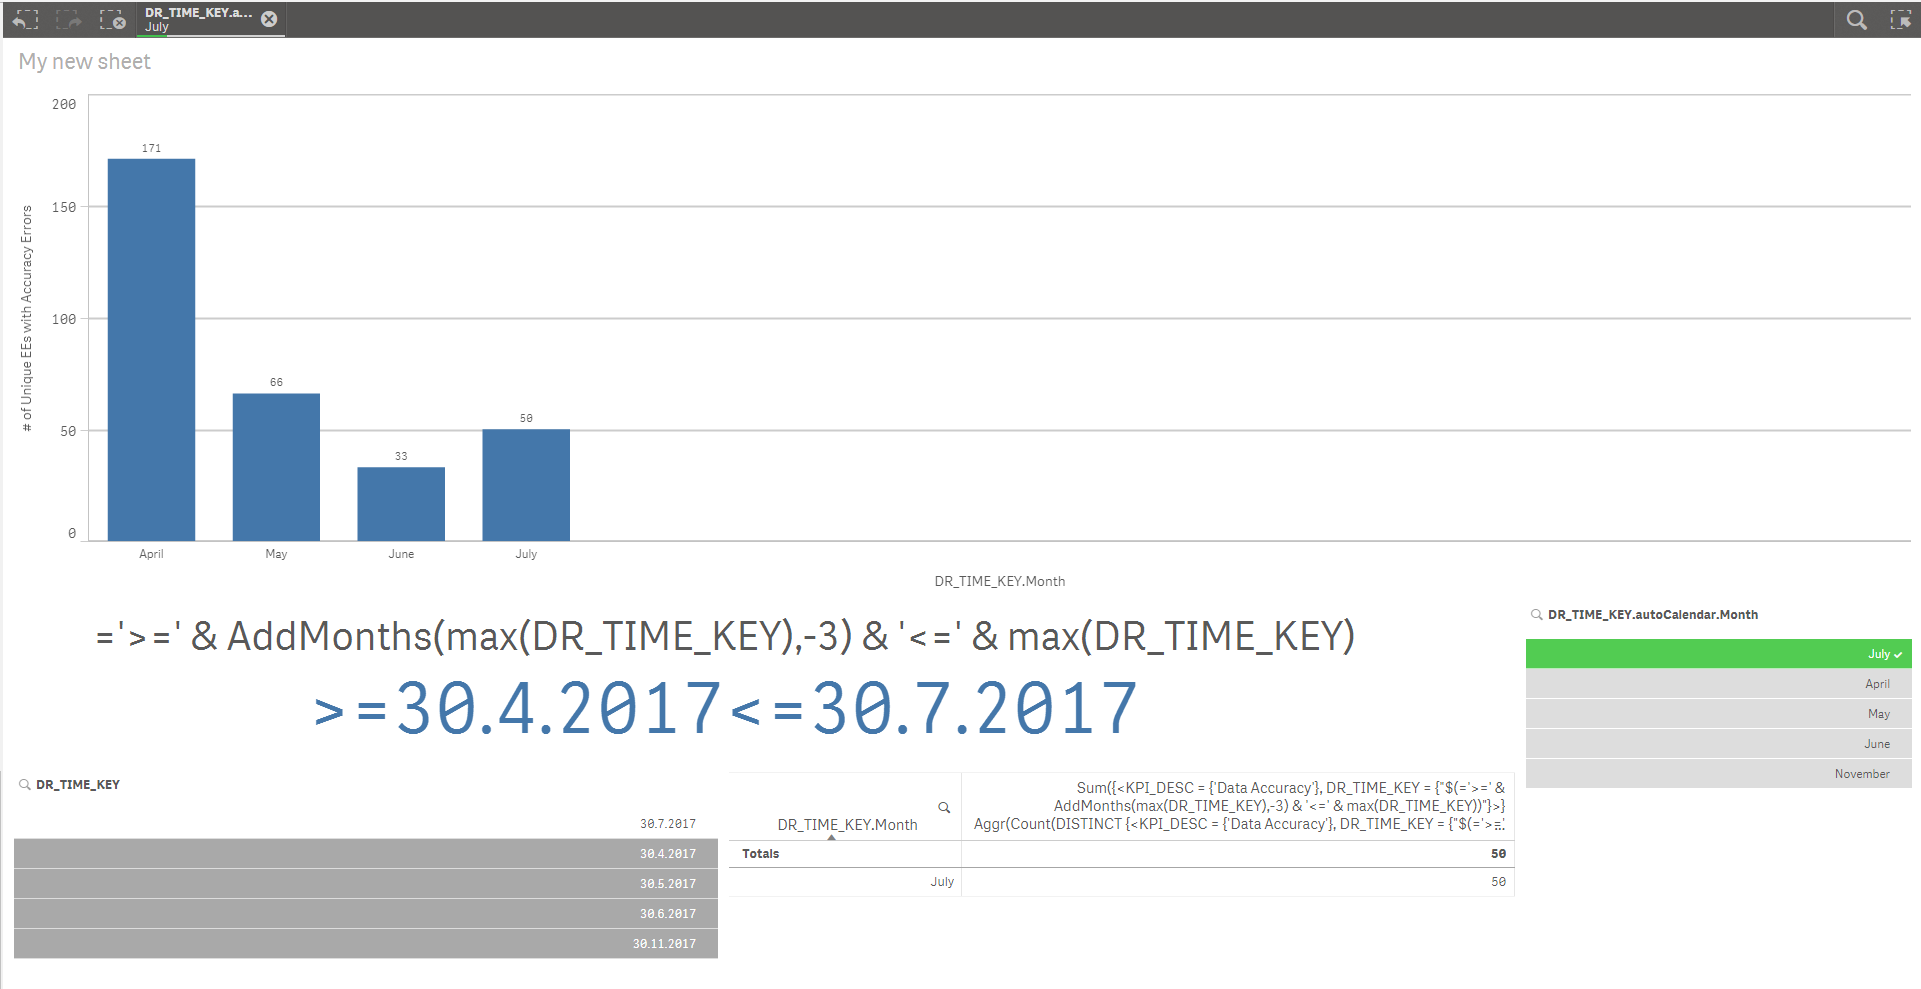
Sum({<KPI_DESC = {'Data Accuracy'}, DR_TIME_KEY = {"$(='>=' & AddMonths(max(DR_TIME_KEY),-3) & '<=' & max(DR_TIME_KEY))"}, [DR_TIME_KEY.autoCalendar.Month]>}
Aggr(Count(DISTINCT {<KPI_DESC = {'Data Accuracy'}, DR_TIME_KEY = {"$(='>=' & AddMonths(max(DR_TIME_KEY),-3) & '<=' & max(DR_TIME_KEY))"}, [DR_TIME_KEY.autoCalendar.Month]>} Routine), DR_GID, Country))
For November, there was no data for August, September, & October... but when I select July... it seems to work
- Mark as New
- Bookmark
- Subscribe
- Mute
- Subscribe to RSS Feed
- Permalink
- Report Inappropriate Content
WOW...... Thanks it's working!!!!! I never know how to write it like you.
Do you know if there is any guidebook or website for setanalysis?
- Mark as New
- Bookmark
- Subscribe
- Mute
- Subscribe to RSS Feed
- Permalink
- Report Inappropriate Content
Try the document attached here