Unlock a world of possibilities! Login now and discover the exclusive benefits awaiting you.
- Qlik Community
- :
- Forums
- :
- Analytics
- :
- New to Qlik Analytics
- :
- Re: How to show value and % in a stacked bar in ql...
- Subscribe to RSS Feed
- Mark Topic as New
- Mark Topic as Read
- Float this Topic for Current User
- Bookmark
- Subscribe
- Mute
- Printer Friendly Page
- Mark as New
- Bookmark
- Subscribe
- Mute
- Subscribe to RSS Feed
- Permalink
- Report Inappropriate Content
How to show value and % in a stacked bar in qlik sense
Hi Guys,
I have created a stacked bar in qlik sense and want to see the values as well as % share for the different segments in the stack. How do I achieve this? Please advise.
Regards,
Rony
- Mark as New
- Bookmark
- Subscribe
- Mute
- Subscribe to RSS Feed
- Permalink
- Report Inappropriate Content
Hi Zhandos,
This worked and I understood you perfectly. Thank you for your help.
Best Regards,
Rony
- Mark as New
- Bookmark
- Subscribe
- Mute
- Subscribe to RSS Feed
- Permalink
- Report Inappropriate Content
Hello Juraj,
I am still not able to get this. I understand that the formula is correct. However, it is not working right on my qlik sense. Is there any other way this can be achieved. Please let me know.
Best Regards,
Rony
- Mark as New
- Bookmark
- Subscribe
- Mute
- Subscribe to RSS Feed
- Permalink
- Report Inappropriate Content
Hi Juraj,
Why is this not working for me? Is there anything else that can be done? Please advice.
Regards,
Rony
- Mark as New
- Bookmark
- Subscribe
- Mute
- Subscribe to RSS Feed
- Permalink
- Report Inappropriate Content
Hi Juraj,
I just figured that the date function is not working right. The moment I remove date (year, month etc) and use any other dimension, its starts working fine. The percentages also come properly and total upto a 100%. Below is a screenshot.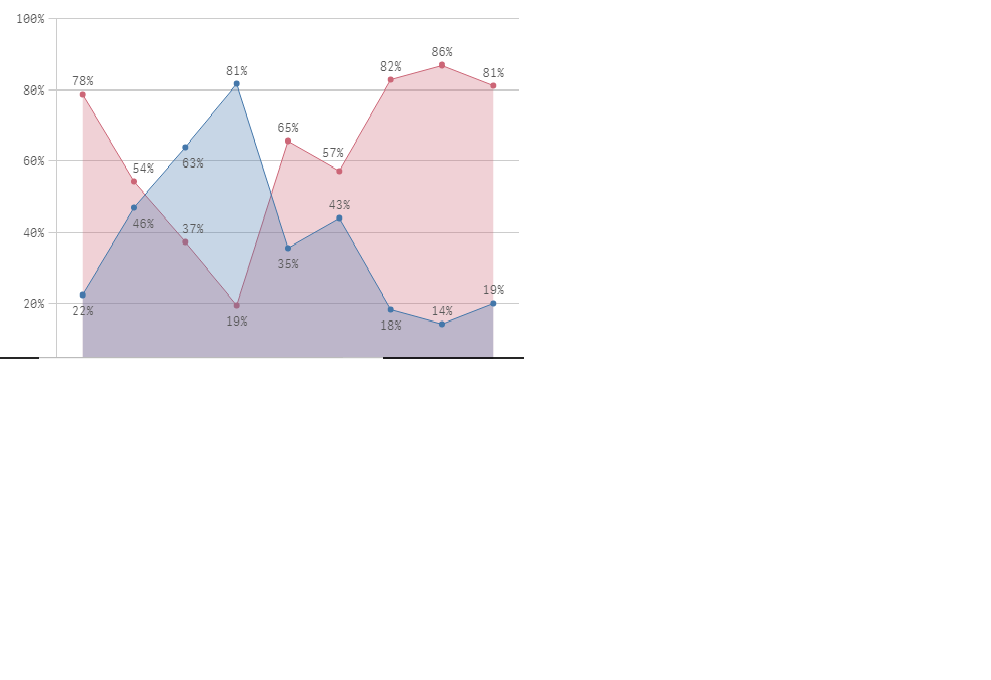 Any suggestions as to why this issue with the dates could be happening?
Rony
- Mark as New
- Bookmark
- Subscribe
- Mute
- Subscribe to RSS Feed
- Permalink
- Report Inappropriate Content
Can you post a screenshot of the data model? Maybe the date dimension is not associated correctly or something.
- Mark as New
- Bookmark
- Subscribe
- Mute
- Subscribe to RSS Feed
- Permalink
- Report Inappropriate Content
Please see below. 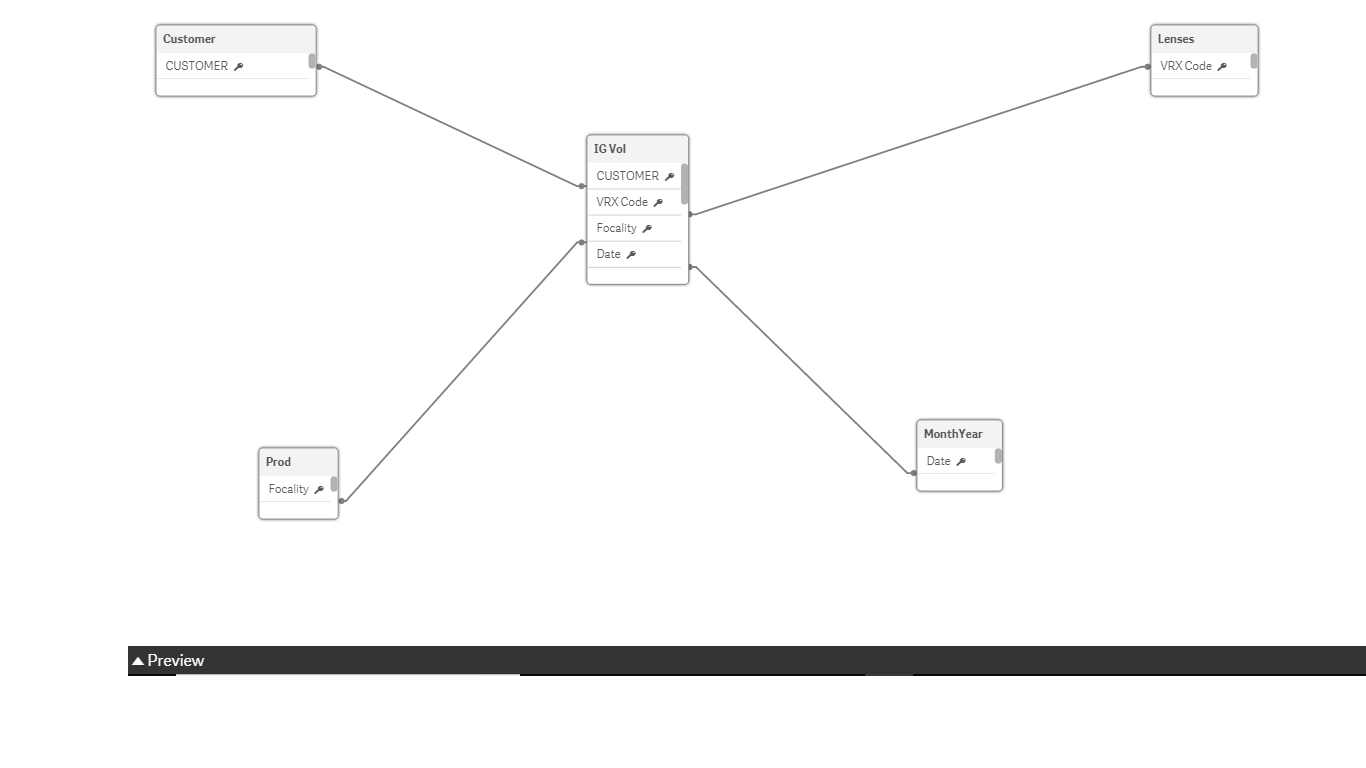
- Mark as New
- Bookmark
- Subscribe
- Mute
- Subscribe to RSS Feed
- Permalink
- Report Inappropriate Content
MonthYear is an additional excel I created where months, month no. quarter etc has been defined.
- Mark as New
- Bookmark
- Subscribe
- Mute
- Subscribe to RSS Feed
- Permalink
- Report Inappropriate Content
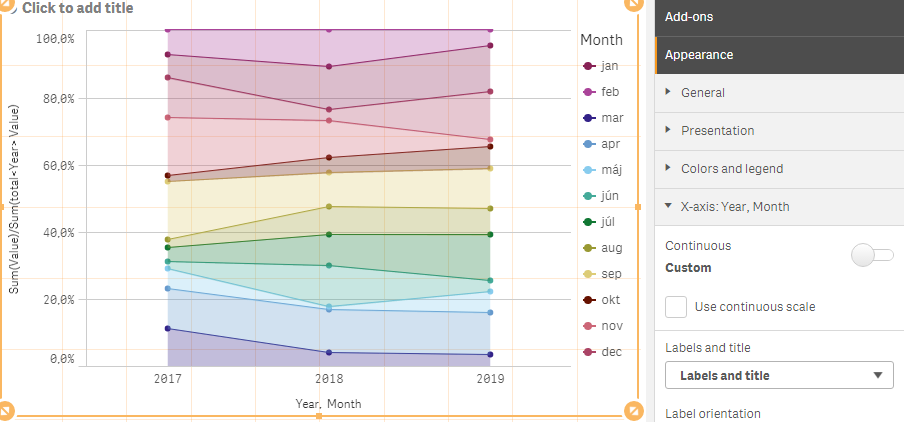
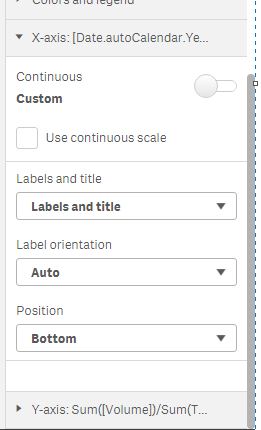
Looking at the screenshot of the original (not working right) chart, this comes to my mind. What is your setting for contitnuous axis?
- Mark as New
- Bookmark
- Subscribe
- Mute
- Subscribe to RSS Feed
- Permalink
- Report Inappropriate Content
Hi Juraj,
I have not check the continuous scale.
- Mark as New
- Bookmark
- Subscribe
- Mute
- Subscribe to RSS Feed
- Permalink
- Report Inappropriate Content
Juraj,
Please let me know if there is any alternative solution.
Rony